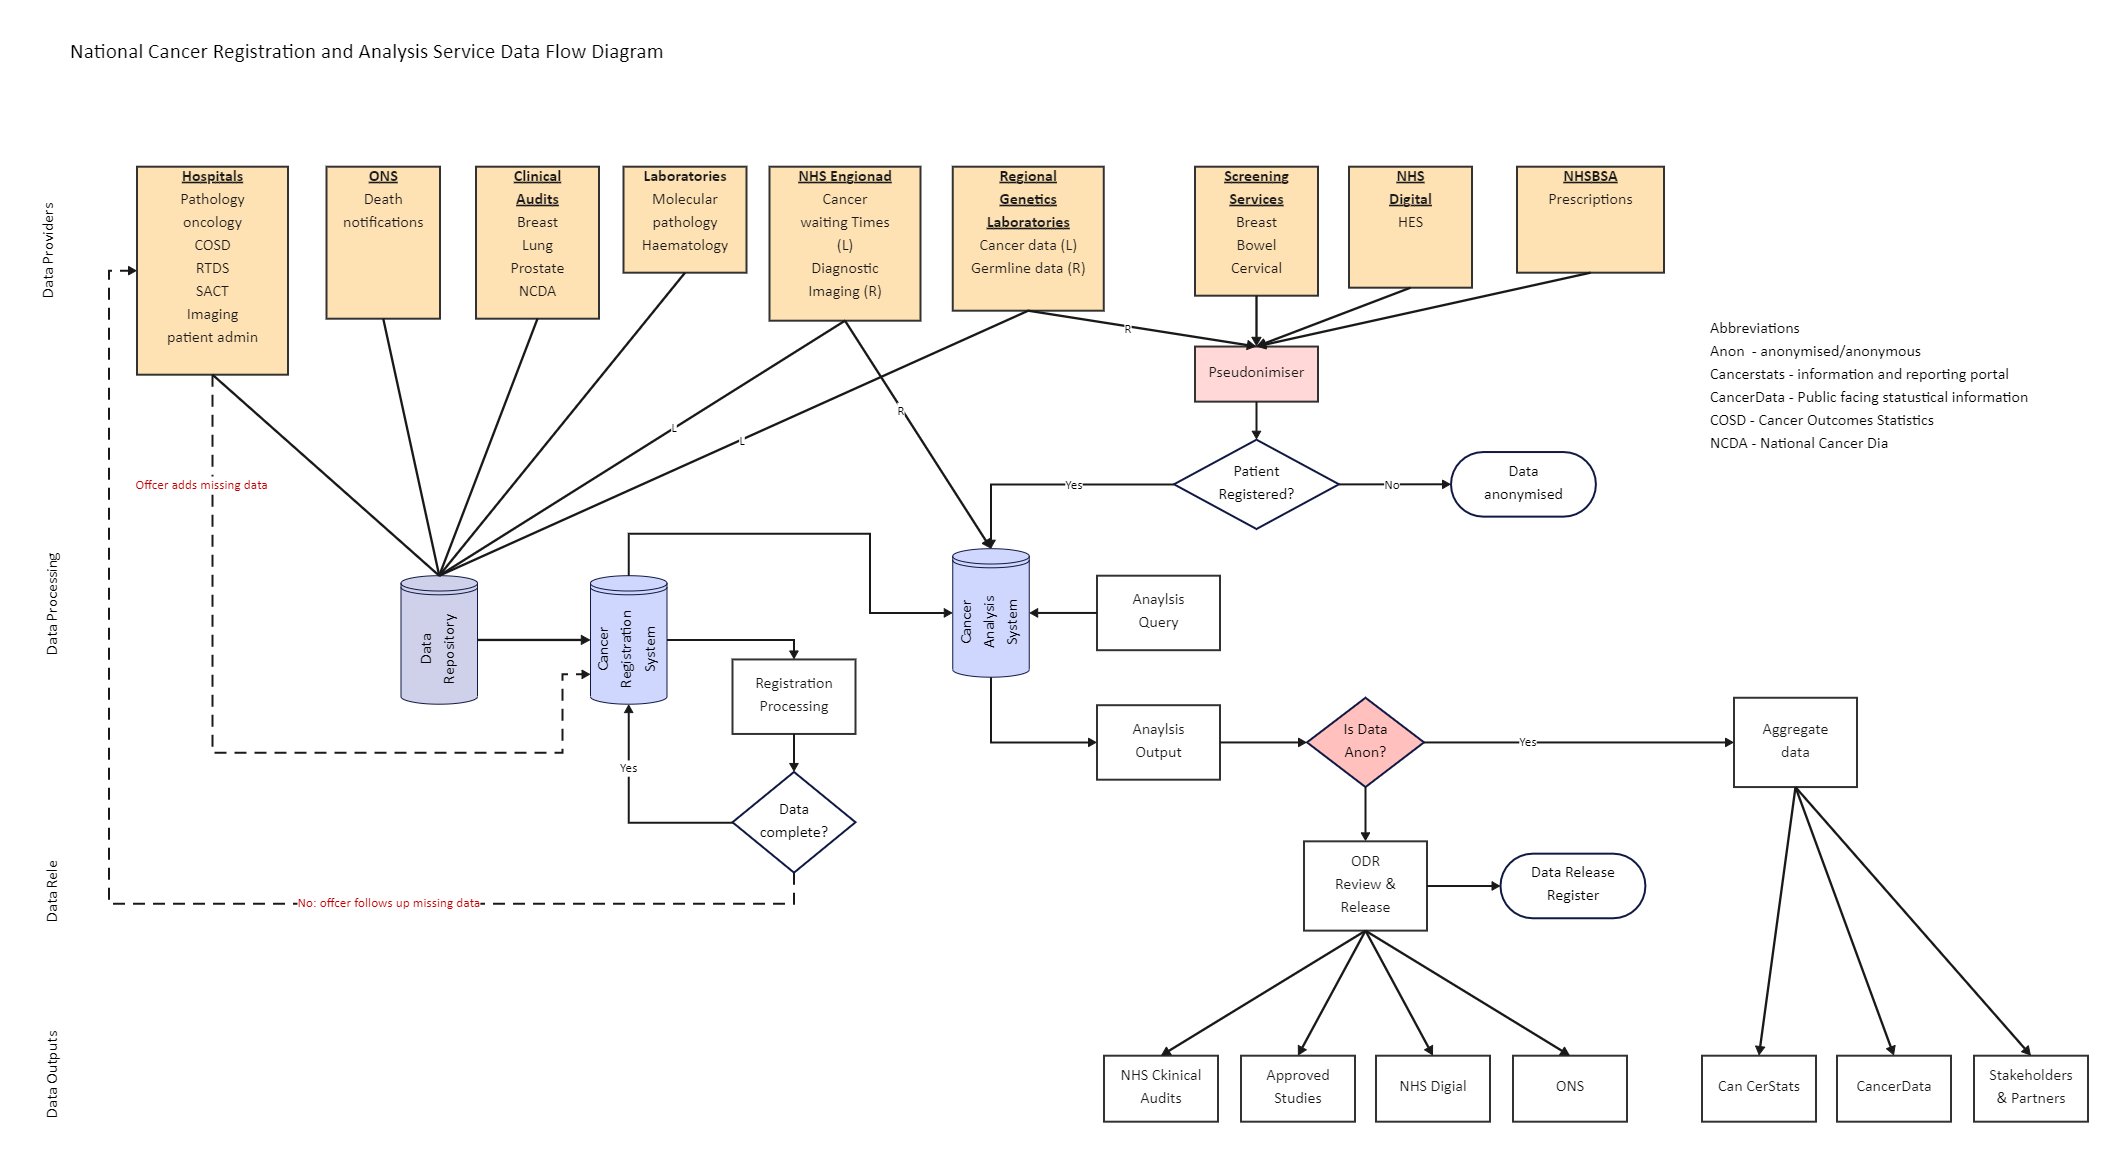
The Analysis Service Data Flow Diagram depicts the information flow for any process or system. It shows data inputs, outputs, storage points, and the routes between each destination using defined symbols such as rectangles, circles, and arrows, as well as short text labels. This Analysis Service Data Flow Diagram depicts data inputs, outputs, storage points, and the routes between each destination using defined symbols such as rectangles, circles, and arrows, as well as short text labels. Data flowcharts can range from simple, even hand-drawn, process overviews to detailed, multi-level DFDs that delve progressively deeper into how data is handled. They can be used to analyze a current system or create a new one.


 Desktop