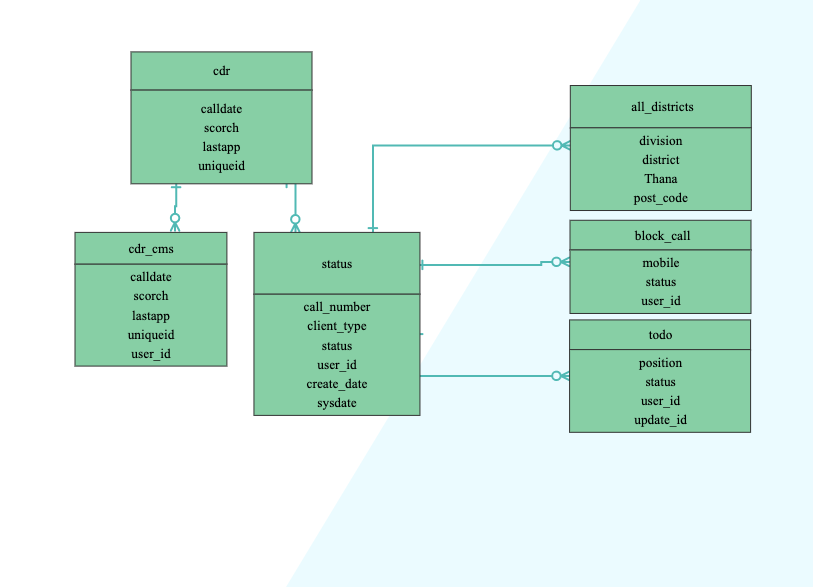
An Entity Relationship (ER) diagram is a graphical representation of the entities and relationships within a Carbon Capture and Sequestration (CCS) project database. It allows for the visual interpretation of data within the database in terms of its relationships to other entities, including fields and tables. A CCS project database typically consists of multiple entities that represent various aspects of a project, such as geologic areas, process components, and emission sources. Each entity is connected to other entities through relationship lines expressing how they interact with one another. An ER diagram can be used to understand complex databases and create efficient queries for data extraction purposes. EdrawMax lets you recreate similar diagrams effortlessly. Download this template from EdrawMax and customize this template as per your requirements.