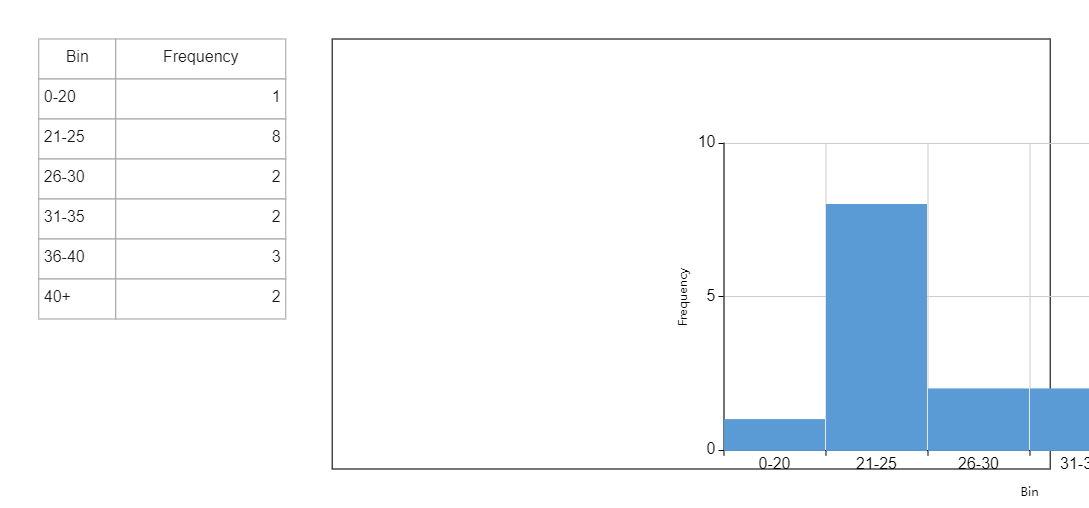
This Histogram Excel is a common data analysis tool in the business world. It is a column chart that displays the frequency of occurrence within a given range. Histogram Excel is a data analysis tool that uses vertical columns to show the periodic rise and drop in data. The Histogram is a well-known graphing tool. It is used to summarise discrete or continuous data on an interval scale. It is frequently used to illustrate the major features of data distribution in an easy-to-understand format. Instead of sorting data by unique values, a histogram sorts it into buckets of closely related values. Google Sheets includes an easy-to-use histogram graphing tool.


 Desktop