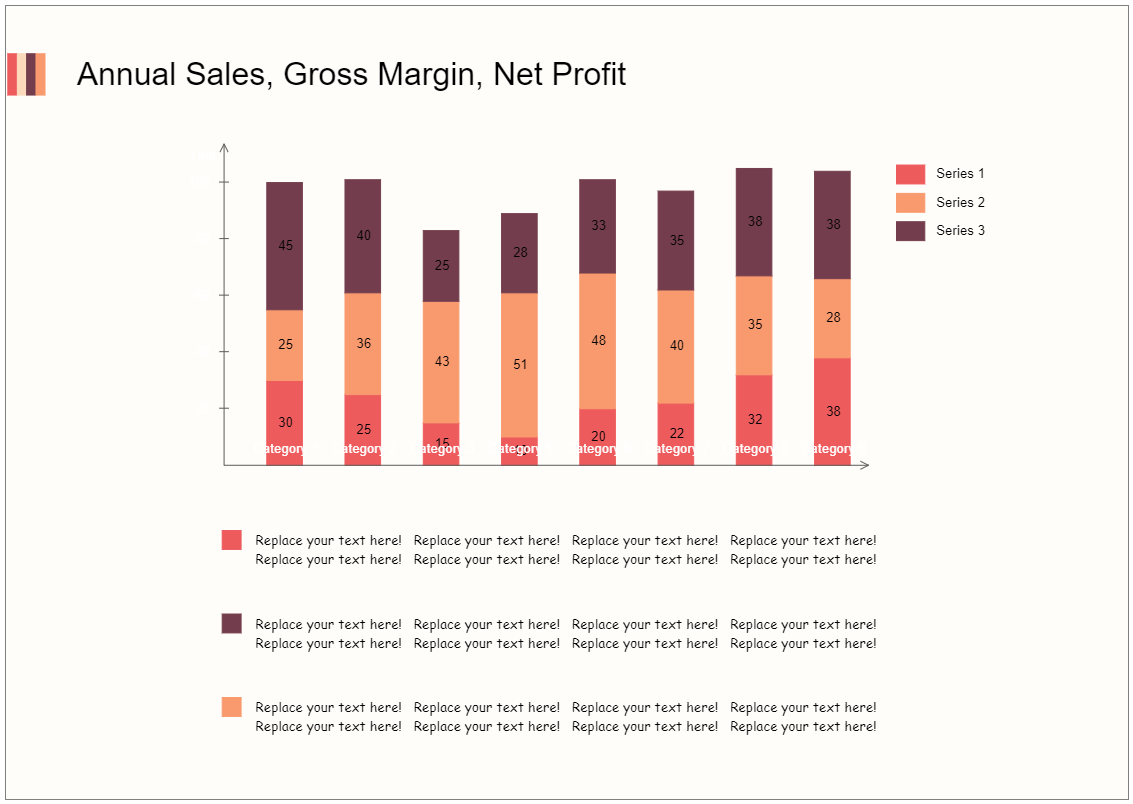
This is an example of a stacked column chart. Using a stacked column chart, this image depicts the annual sales, gross margin, and net profit. A stacked column chart is a fundamental Excel chart style that allows for part-to-whole comparisons over time or across categories. Generally speaking, in a stacked column chart, data series are placed one on top of the other in vertical columns. Because total column lengths are easily compared, stacked column charts may demonstrate change over time. Layered Column Chart is made up of many column series stacked vertically on top of one another. The length of each series is defined by the value in each data point. They are an excellent choice if you need to see how numerous variables and their interactions interact at the same time. You may also download this free template in EdrawMax to design your own stacked column chart.