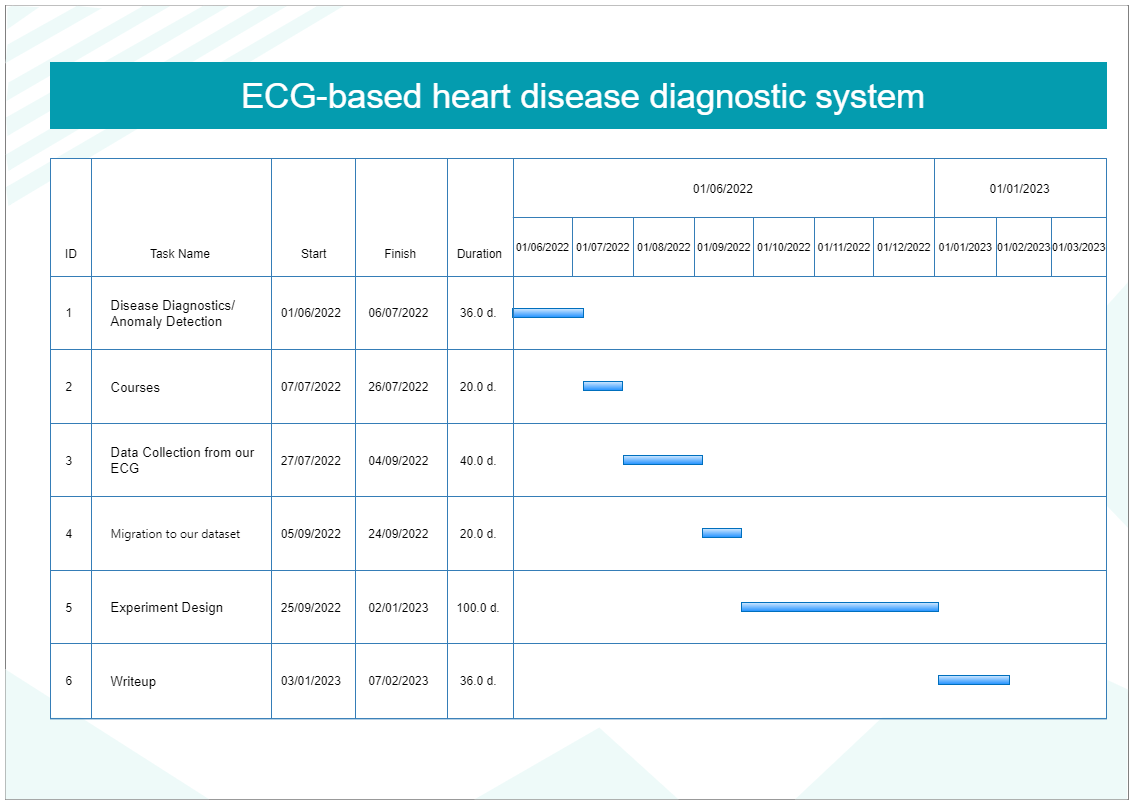
This is a Gantt Chart example. A Gantt chart is a horizontal bar chart that was created in 1917 as a production control tool by American engineer and social scientist Henry L. Gantt. A Gantt chart, which is frequently used in project management, offers a pictorial representation of a timetable that may be used to plan, organize, and track tasks in a project. EdrawMax is the perfect tool to draw a Gantt chart.