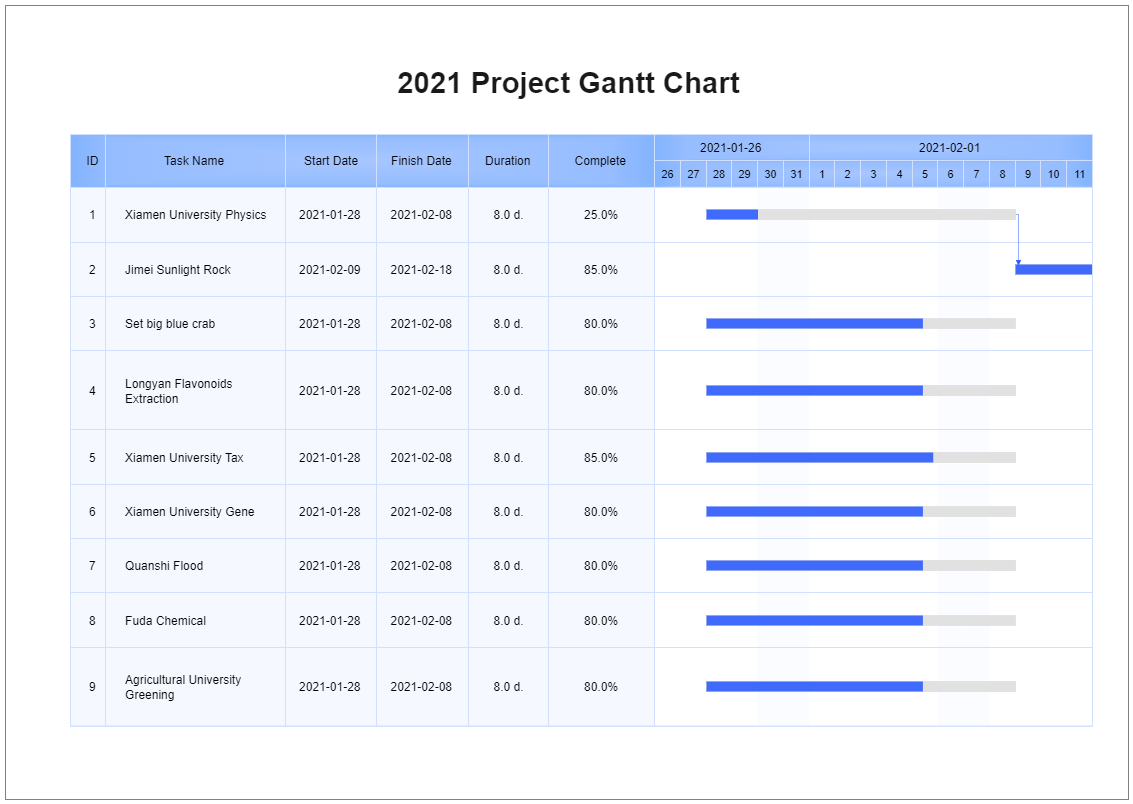
This is a project Gantt chart. A Gantt chart is a popular graphical representation of a project schedule. It's a type of bar chart that displays the start and end dates of project elements like resources, planning, and dependencies. The Gantt chart is the most common chart used in project management. These charts are useful for project planning and defining the sequence of tasks that must be completed. Download EdrawMax and start creating a Gantt chart in a few steps.