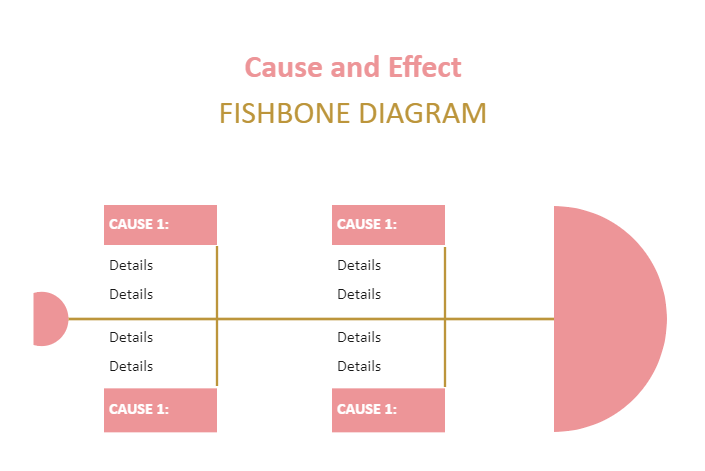
This Cause and Effect Relationship A Fishbone Diagram is a visual tool for classifying potential causes of a problem. This tool is used to determine the root causes of pain. A fishbone diagram, commonly used for root cause analysis, combines brainstorming with a mind map template. It should work well as a test case technique for determining cause and effect. A Cause and Effect Relationship, The Fishbone Diagram, is useful in product development and troubleshooting processes, and it is typically used to center a conversation on a problem. After the group has brainstormed all the potential causes of pain, the facilitator assists the group in rating the possible causes in order of importance and diagramming a hierarchy.