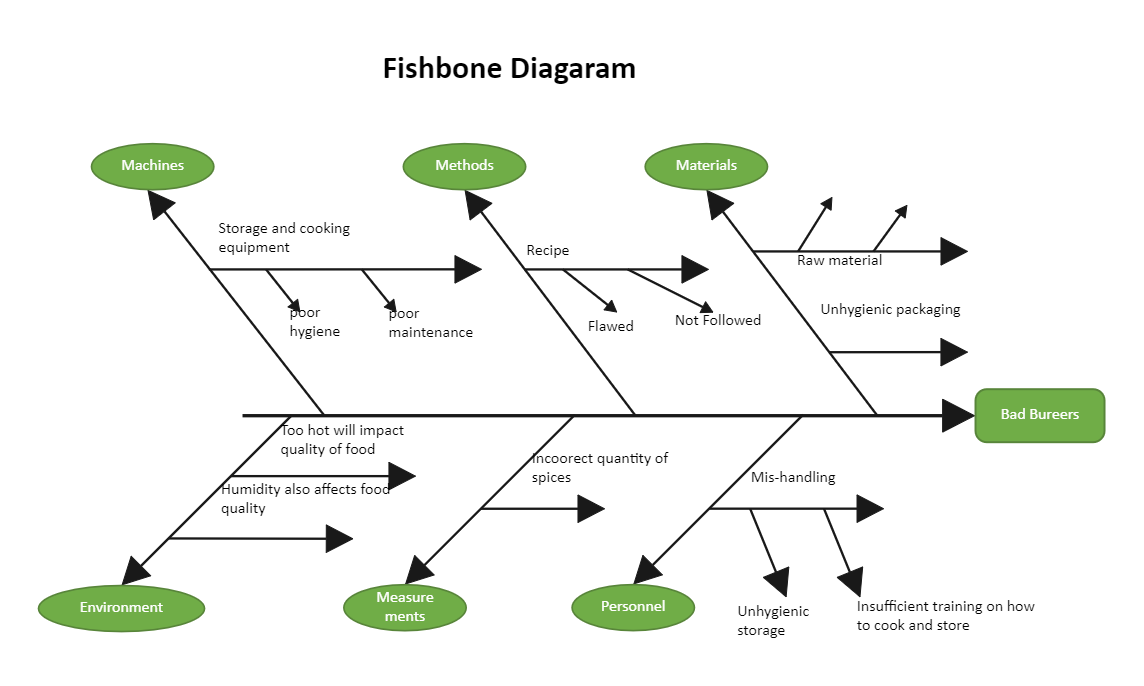
The fishbone diagram, aka the Ishikawa diagram, is a cause-and-effect diagram that assists managers in determining the causes of flaws, variations, defects, or failures. The diagram resembles a fish's skeleton, with the problem at the top and the reasons feeding into the spine. Once all the underlying causes of the pain have been identified, managers can begin looking for solutions to ensure that the problem does not reoccur. The fishbone diagram attempts to identify everything wrong with current market offerings to develop an innovation that does not have these issues.