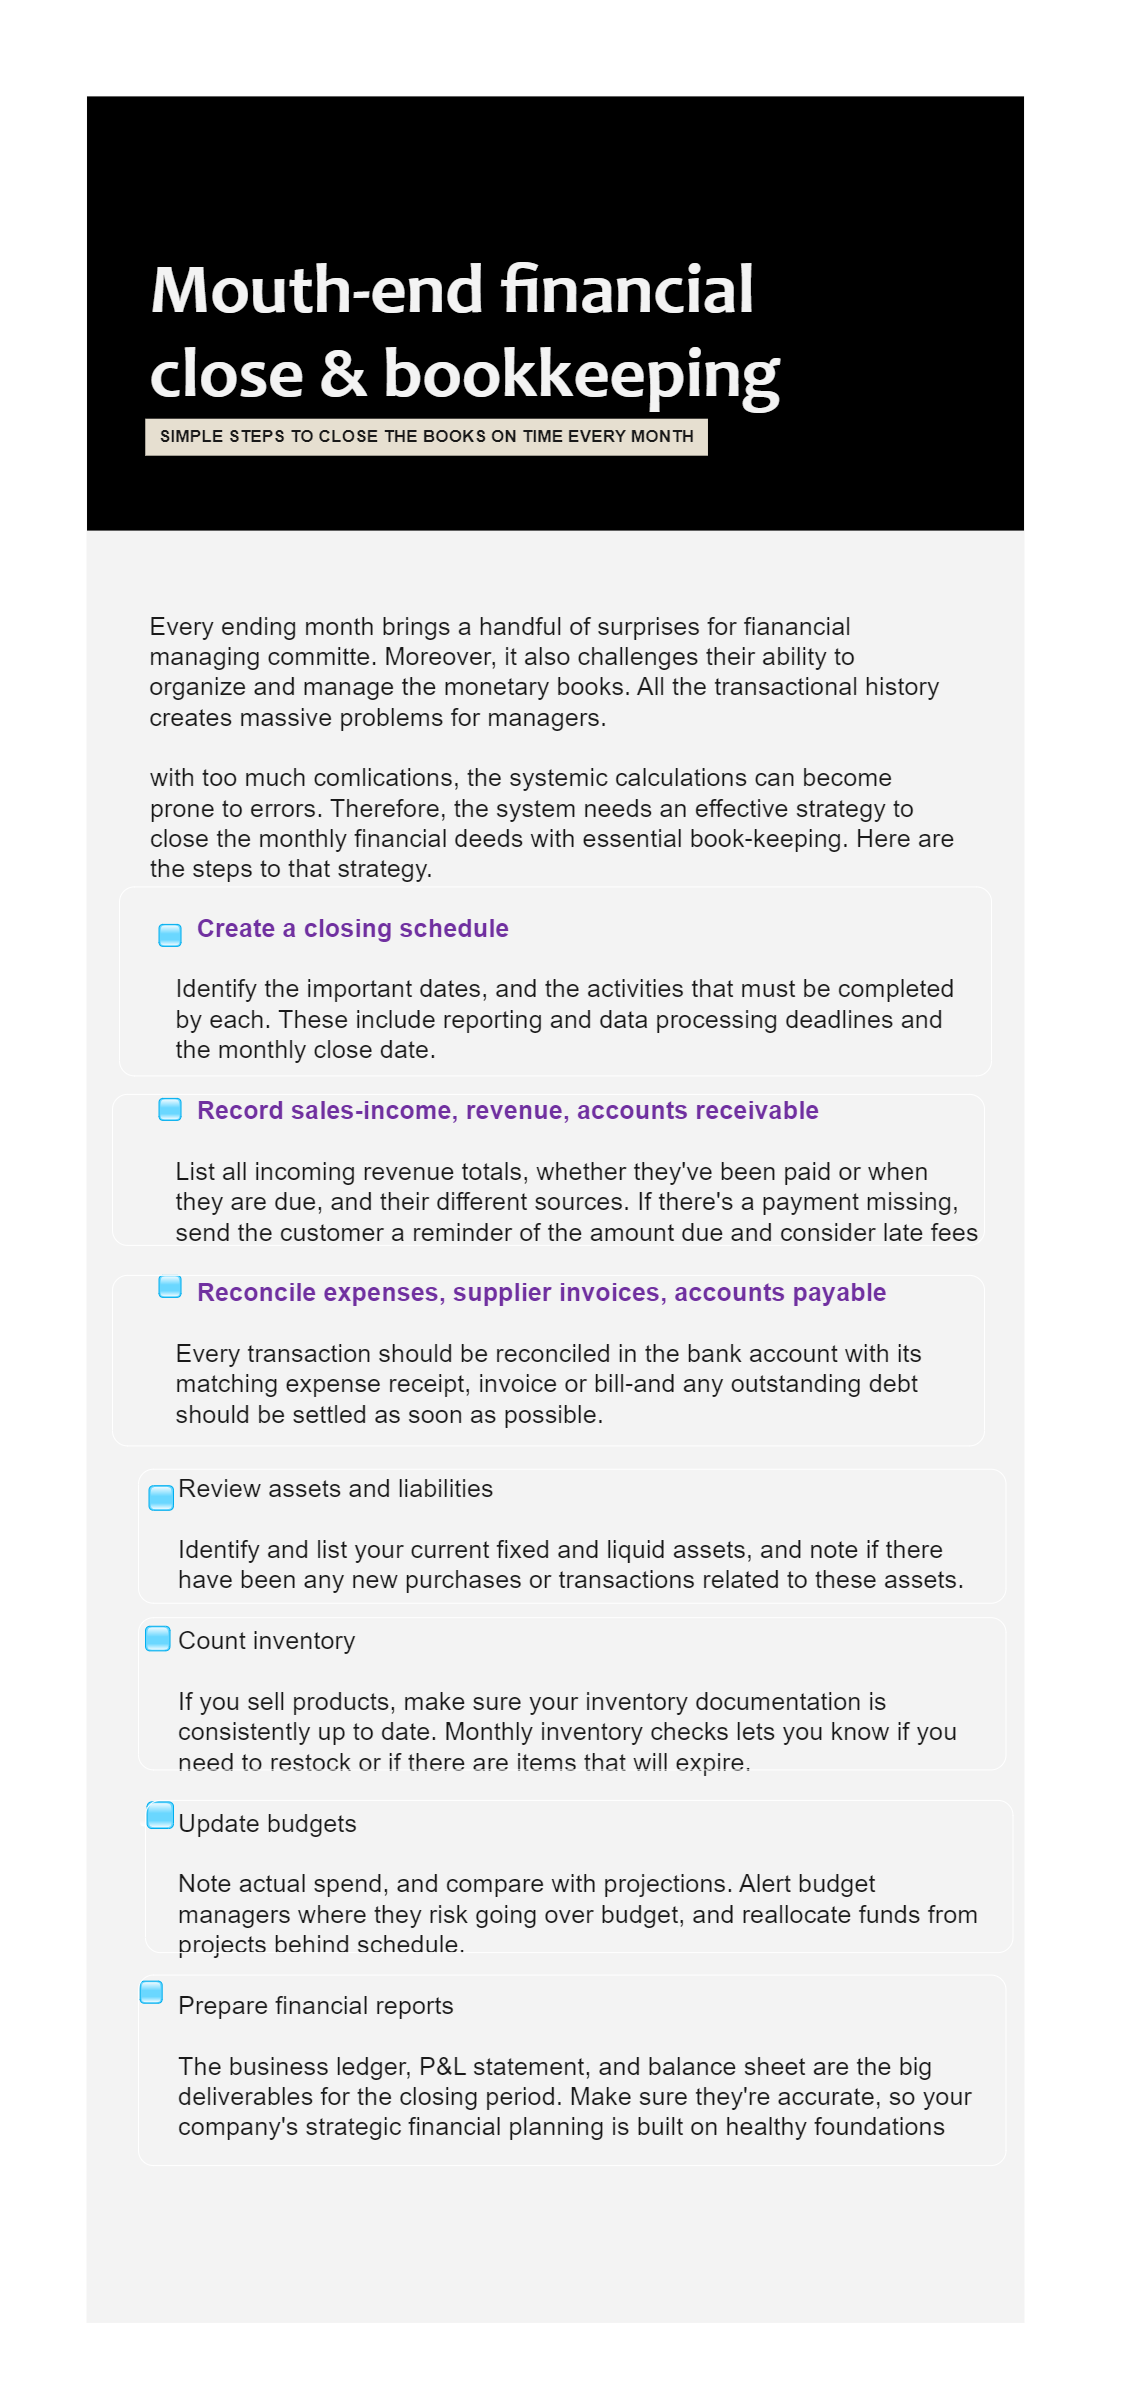
This flowchart has one of the simplest interface with steps to deal with month-ending financial statements. The chart has steps listed with small descriptions that tell the readers what they need to do. Besides that, it has a physically presentable interface that can help readers keep their interest in. On the top, you can see a title page sector that briefly highlights the content given below. With all the content in place, you can witness a series of checkboxes in the chart. These are completely functional and help the manager or user mark completed tasks.