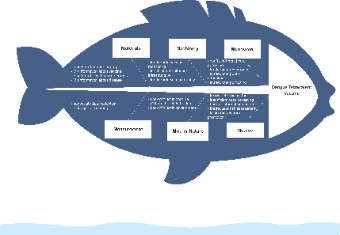
Delve in this Ishikawa Diagram, also known as a Fishbone Diagram or a Cause-and-Effect Diagram, for the challenges to Dengue Tetravalent Vaccine development. As the template shows, the deficiencies of the vaccine is listed on a separate branch, including the aspects of manpower, method, measurement, etc., and sub-causes can be further branched out from the these aspects. This helps to identify and prioritize the root causes of a problem, making it easier to develop solutions. Fishbone Diagrams are widely used in industry, healthcare, and other fields to improve processes, reduce errors, and increase efficiency.