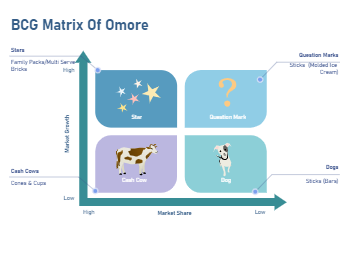
This BCG Matrix diagram illustrates the strategic positioning of Omore's product lines within four distinct categories: Stars, Question Marks, Cash Cows, and Dogs.
The Stars represent products with high market growth and high market share, indicating potential market leaders. Question Marks have high market growth but low market share, suggesting uncertainty and the need for further investment to become Stars or the risk of becoming Dogs. Cash Cows are products with low market growth but high market share, generating stable cash flows with less investment. Dogs have low market growth and low market share and may be considered for divestiture.
This matrix provides a visual tool for Omore to allocate resources and make strategic decisions regarding their products.