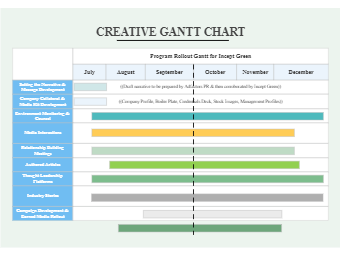
A Gantt chart is a graphical representation of a project's timeline, showing the start and end dates of each task, as well as the dependencies between tasks. Here is a gantt for Public Relations Program. This template consists of a horizontal axis representing time, and a vertical axis representing the different tasks or activities in the project. Each task is represented by a bar, with the left end of the bar indicating the task's start date, and the right end indicating the task's end date. It is a useful tool for professors or managers to plan and schedule complex projects, and to track progress over time.