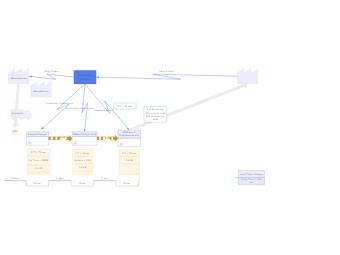
This Value Stream Map (VSM) outlines the production process for orange juice, from manufacturing to distribution. It details the flow of daily orders, production control, and shipment, along with specific process steps such as preparing the oranges, making the juice, and bottling and distribution. Each process step is annotated with cycle times, uptime percentages, and shift information to provide insights into the efficiency of the production line. This type of map is a crucial tool in lean manufacturing and continuous improvement efforts, helping businesses identify waste and areas for process optimization. Check this template to know more details or learn more from EdrawMax templates gallery.