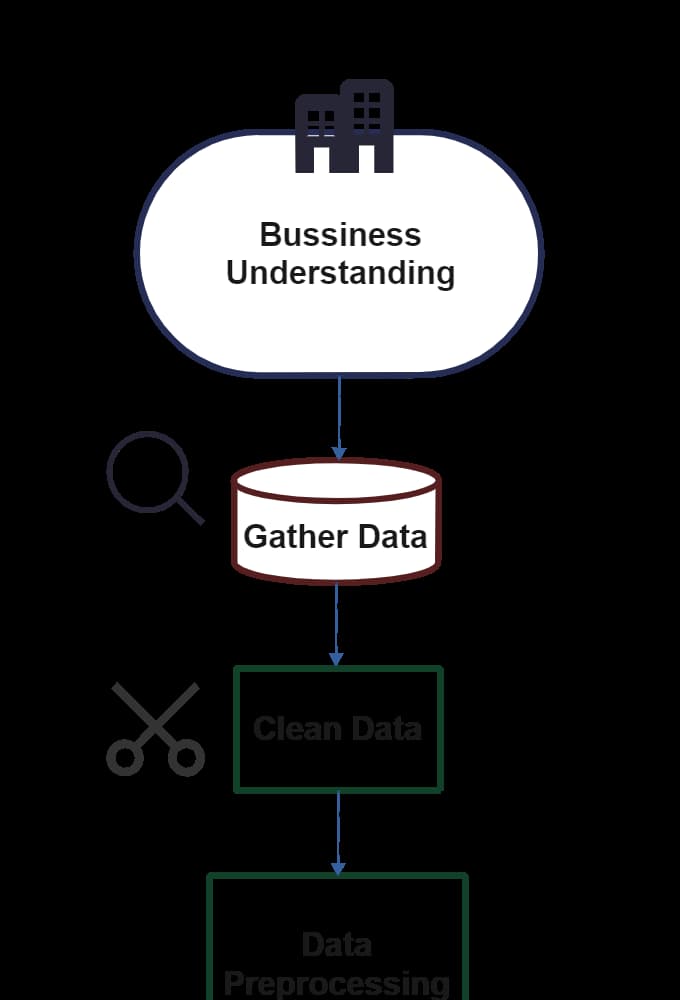
This flowchart, crafted using Edrawmax, comprehensively demonstrates the entire process of commercial data, from collection, cleaning, preprocessing, to data visualization and insights. The process covers the fundamental work of data collection, utilizes Python and SQL for data cleaning and preprocessing, leverages Power BI and Tableau for visual analysis, and ultimately extracts valuable business insights to support decision-making for end-users. Through this flowchart, users can clearly understand each step of the commercial data processing, enabling more effective data-driven business decisions.