Community
Collections
Collections
Challenge
Online Use
Download
Pricing
Publish
sign in
sign up
Templates Community
Discover, learn and get inspired by
0+
of free editable templates for your next project!
Popular
All
All
Business
Marketing
HR & Operation
Product
IT & Engineering
Building Plan
UI & UX
Education
Life
Others
Symbol
Loading
Edit online
Upgrade
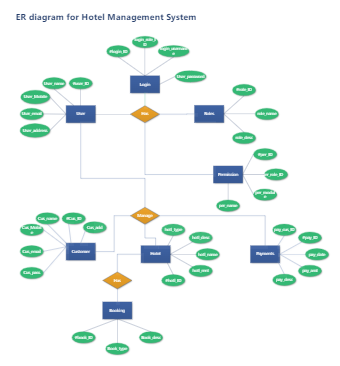
ER diagram for Hotel Management System
Ashley
64.0k
6.9k
141
Edit online
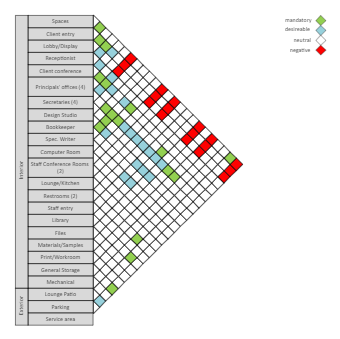
Architecture Matrix Diagram
Joy
57.0k
12.7k
113
Edit online
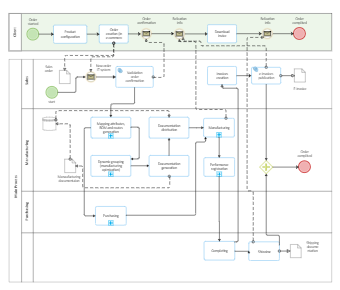
Main Process BPMN Notation
Kiraaaa
23.0k
5.6k
171
Edit online
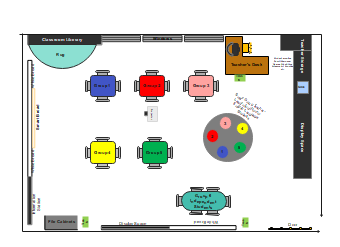
Class Room Layout Management
Sabrina McLean
8.4k
2.7k
67
Edit online
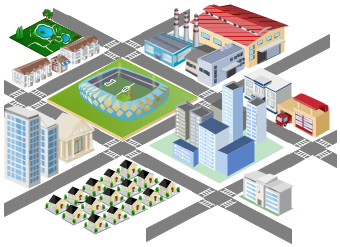
3D City Directional Map
PEÑARANDA, JOHN MAXIE
12.4k
5.2k
113
Edit online
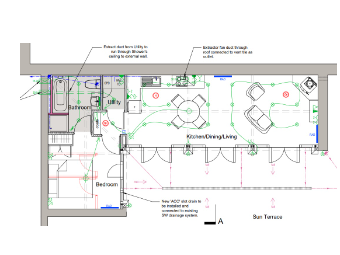
Electrical Wiring Plan in Detail
WSvQ7ADw
18.4k
4.9k
159
Edit online
Infographic Examples for Students
Joy
3.0k
730
27
Edit online
Upgrade
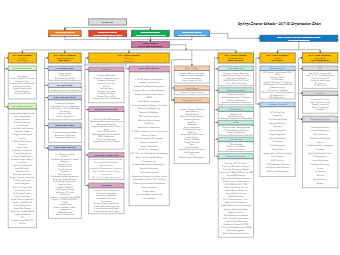
School Organizational Chart
Captain O Captain
20.8k
2.9k
114
Edit online
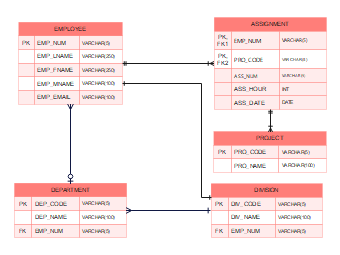
ERD for Construction Company
Elgen Prestosa
5.0k
1.1k
28
Edit online
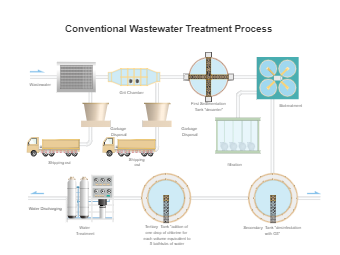
PID Water
yandry stanley delgado menoscal
4.5k
1.7k
66
Edit online
Upgrade
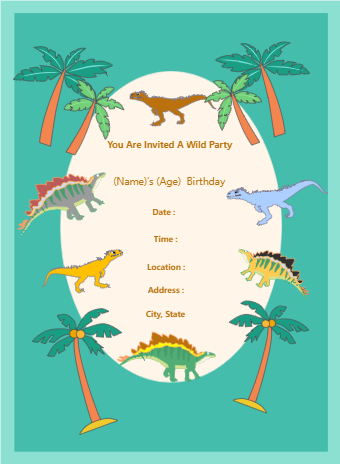
Blank Dinosaur Invitation Card
Captain O Captain
2.7k
293
18
Edit online
Upgrade
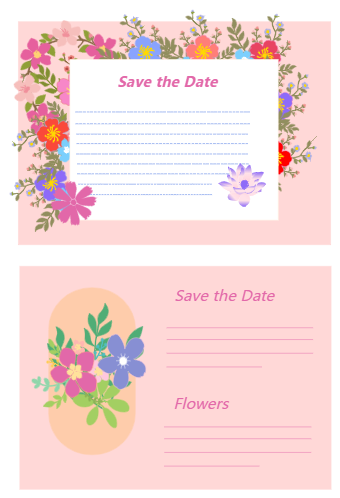
Blank Invitation Card
Captain O Captain
2.5k
366
20
Edit online
Upgrade
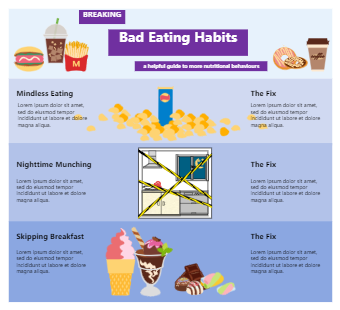
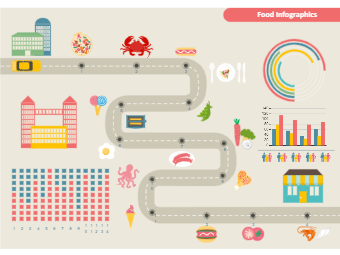
Food Distribution Infographic
Captain O Captain
2.3k
489
28
Edit online
Upgrade
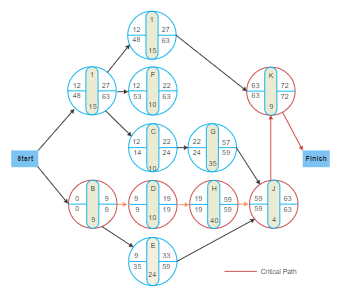
PERT Chart Template
Ashley
2.9k
453
22
Edit online
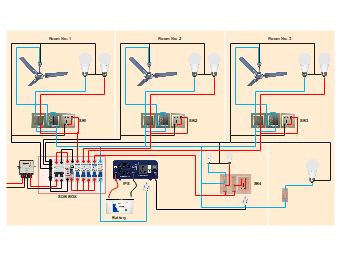
Complete House Wiring Diagram
Sora
10.0k
2.5k
86
Edit online
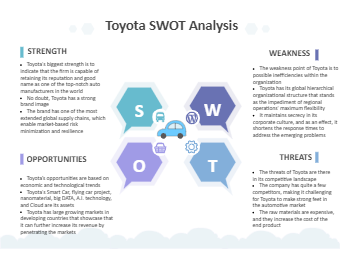
Toyota SWOT Analysis
Lisa Anderson
2.8k
788
38
Edit online
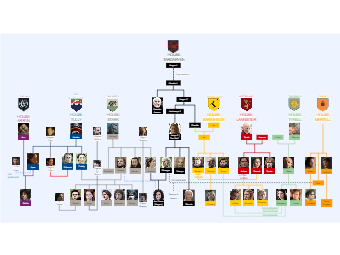
Game of Thrones Family Tree
Kiraaaa
406.7k
9.2k
60
Edit online
Upgrade
Flowchart Infographic
Community Helper
5.1k
2.1k
75
Edit online
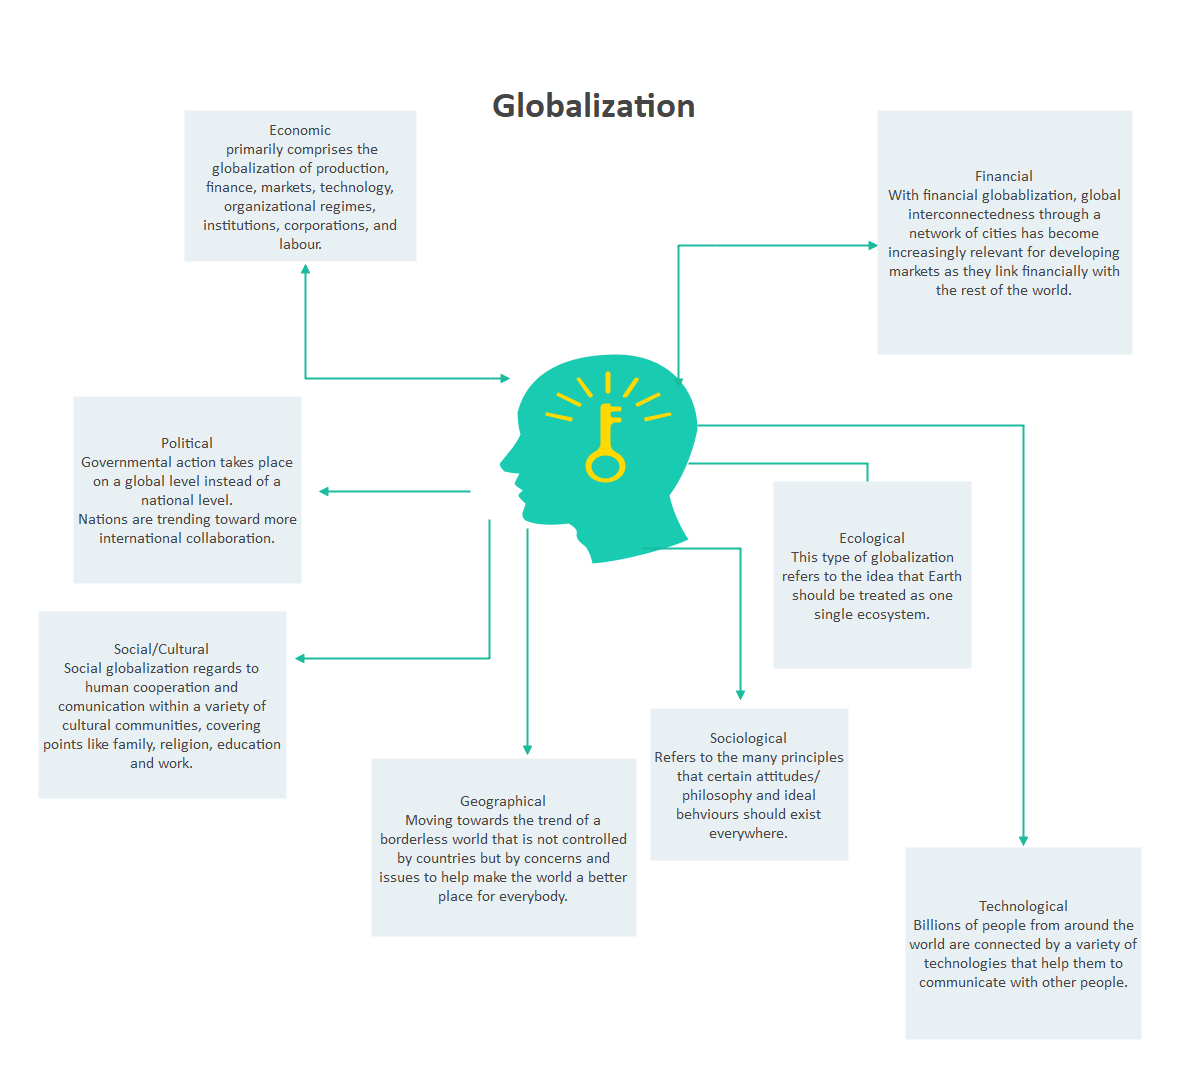
Concept Map about Globalization
greemryanlester
30.6k
2.7k
81
Edit online
Upgrade
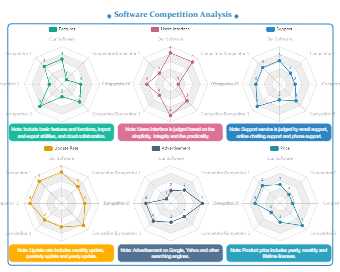
Radar Chart Excel
Captain O Captain
2.3k
722
37
Edit online
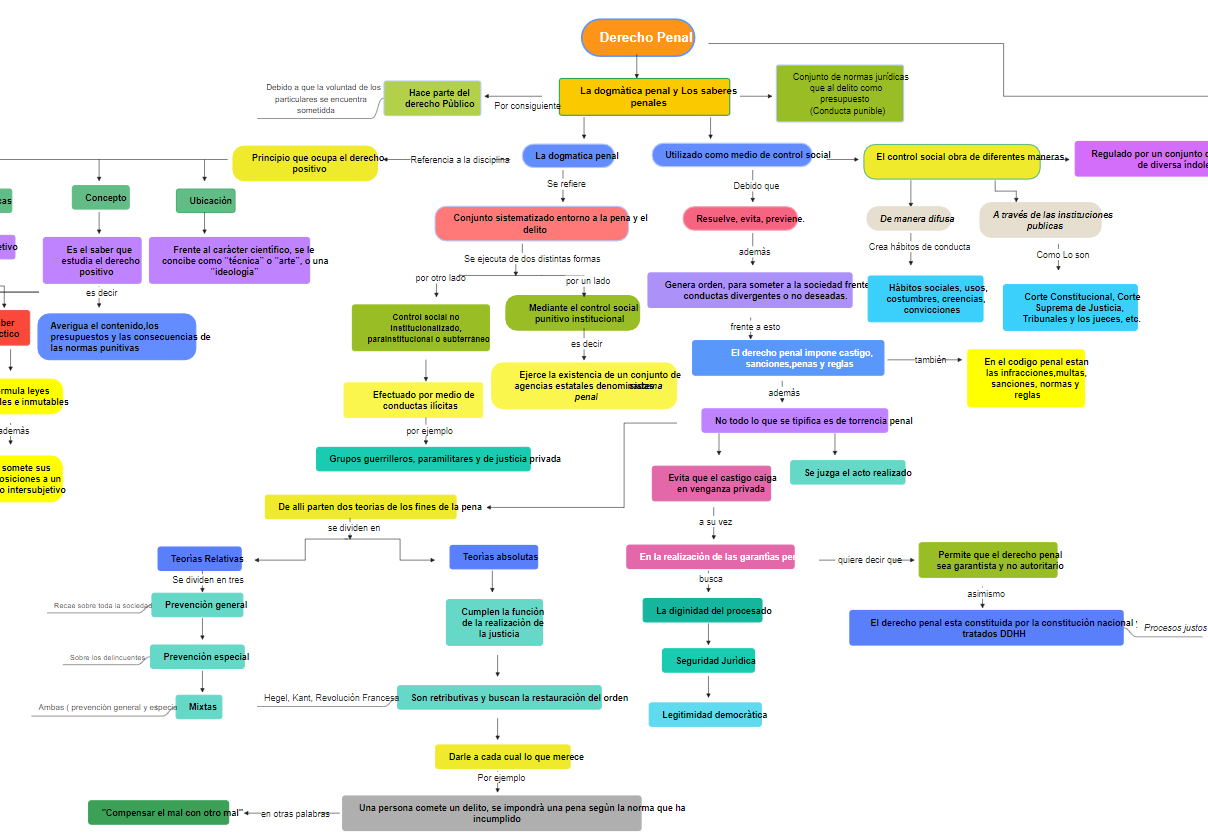
Concept Map for Criminal Law
WSBZHg1Z
4.6k
1.0k
52
Edit online
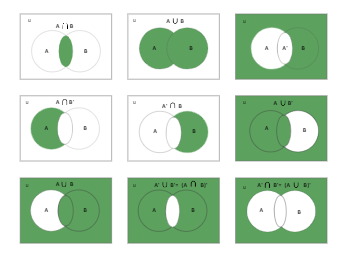
A U B Venn Diagram
Lisa Anderson
10.4k
324
16
Edit online
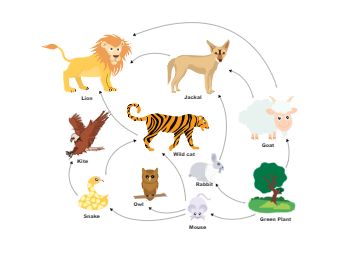
Natural Food Web
Kiraaaa
6.9k
608
32
Edit online
Upgrade
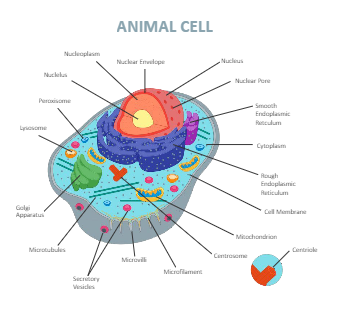
Animal Cell Diagram Labeled
Community Helper
11.1k
652
52
Edit online
Upgrade
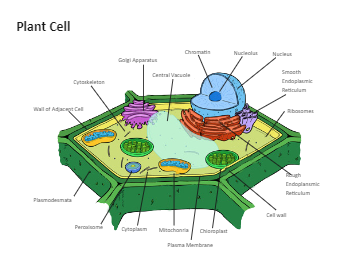
Plant Cell Diagram Labeled
Community Helper
13.8k
417
39
Edit online
Upgrade
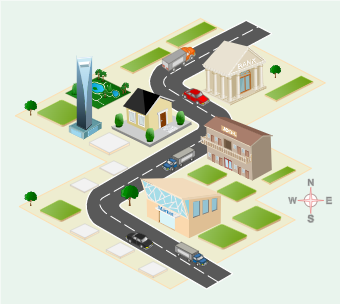
Isometric City map
Captain O Captain
2.7k
1.2k
42
Edit online
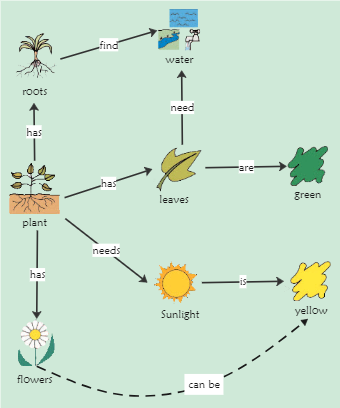
Plant Concept Map
Kiraaaa
1.8k
228
11
Edit online
Upgrade
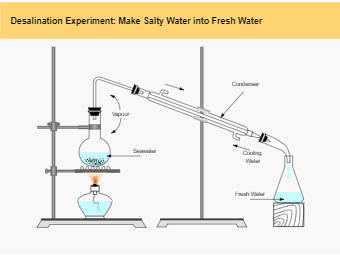
Desalination Experiment Lab Drawing
Ashley
2.0k
561
36
Edit online
Upgrade
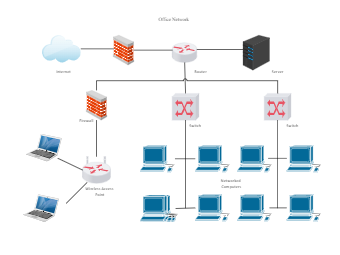
Office Network
Captain O Captain
25.6k
2.0k
68
Edit online
Upgrade
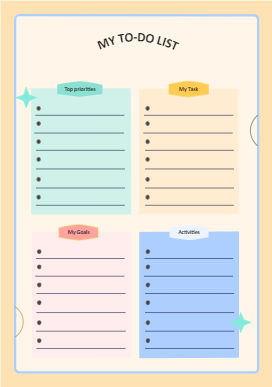
To-Do List
Community Helper
9.4k
696
43
Close
Close