Free Editable Fishbone Diagram Examples
In this article, we explore what a fishbone diagram is, why and how it is important or used as an analytical tool. The different contexts or problem-solving sessions where it can be used are also highlighted along with software solutions for the same.
1. What is A Fishbone Diagram?
Fishbone diagrams are also known as cause and effect diagrams or Ishikawa diagrams. These can also be called cause enumeration or process fishbone diagrams or showcasing time-delays. The short form for cause and effect diagram is CEDAC which can be done with cards as well.
Such illustrations can be reverse fishbone type as well. No matter what they are called, these diagrams act as analytical tools to look at the different causes that lead to a certain effect. It is one of the quality tools that was invented to understand how a problem occurs and the effects of the same. you can learn more about what is a genogram. The fishbone diagram examples help you to sort out ideas that can then be put in distinct categories.
1.1. The Usage of Fishbone Diagram
As for the useage of fishbone diagram, the common uses of the fishbone diagrams include the prevention of quality defects in the manufacturing process as well as product designs. It helps to identify factors that are leading to a certain effect. It is commonly used for quality improvement and product development. It also becomes useful for brainstorming sessions when problems are being identified.

2. The Fishbone Diagram Examples
There are different kinds of fishbone diagrams that one can look up in order to understand how simple or complex problems are sorted as per probable causes.
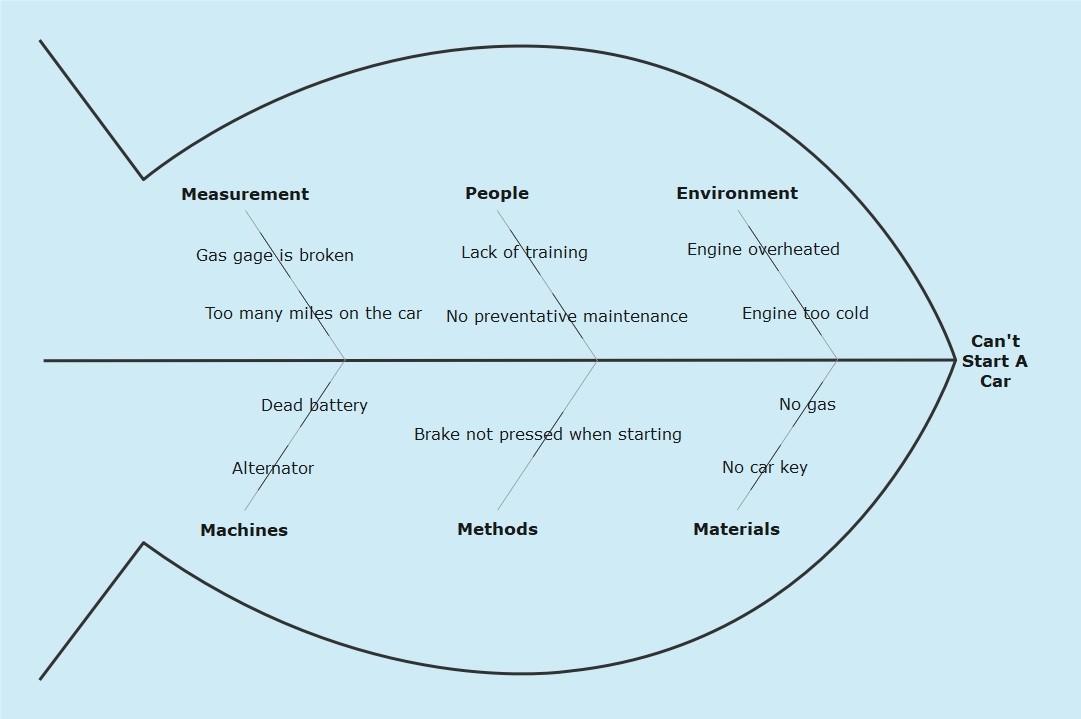
Example 1: Simple Fishbone Diagram Example
 Source:EdrawMax Online
A simple fishbone diagram example can be in the context of manufacturing in order to highlight what are the main branches that form the entire chain of a manufacturing process. The fix processes comprise 6 Ms that stands for material, measurement, Mother Nature or milieu, manpower, and method.
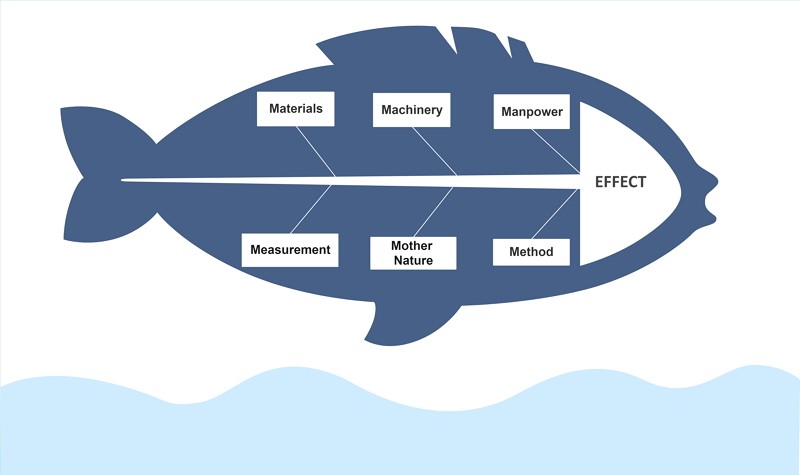
Example 2: Funny Fishbone Diagram
 Source:EdrawMax Online
Any problem and its probable causes can be showcased with a funny cause and effect diagram example as well. It helps especially to draw the attention of children or young minds when a problem solving is being attempted with visual aids in class. For instance, the five whys can be illustrated with a funny image in order for viewers or participants to understand the visuals easily.
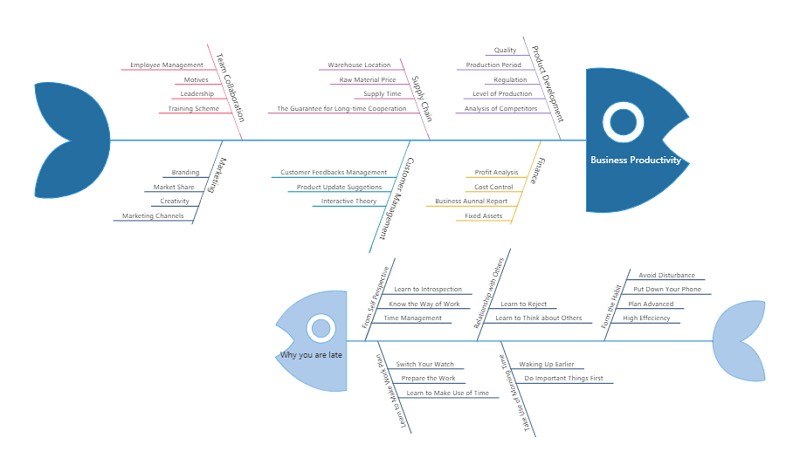
Example 3: Business Fishbone Diagram
 Source:EdrawMax Online
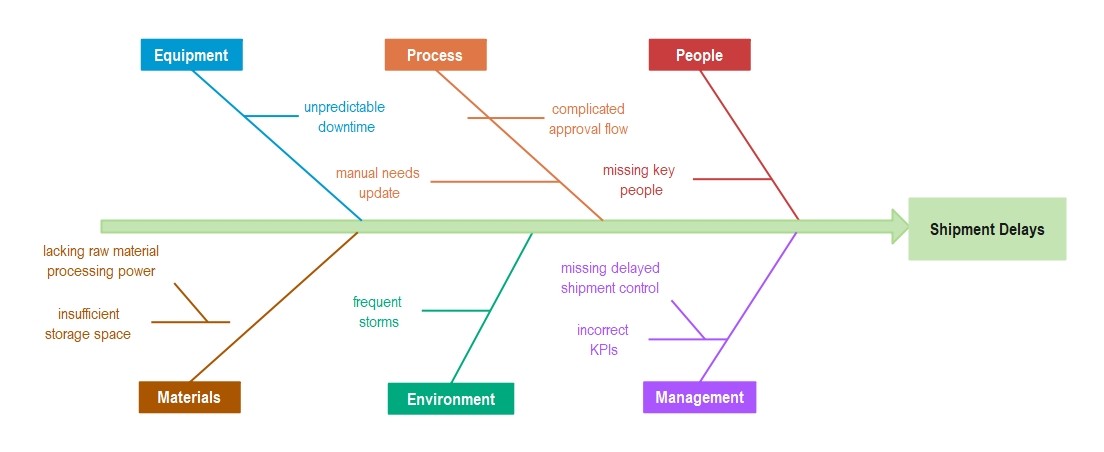
There are widespread uses of cause and effect diagram example in businesses. For instance, if the low-quality output is a concern, the different branches or probable causes are first identified under broad categories such as management, raw materials, technology, working conditions, machine and workers. For each branch or category there are sub-branches that are highlighted which are constraints that contribute to hindering output.
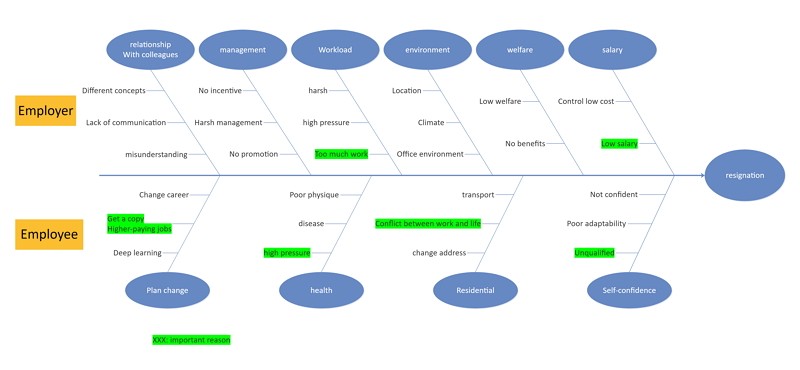
Example 4: Service Industry Fishbone Diagram
 Source:EdrawMax Online
One can also see a fishbone diagram example in the context of problems that arise in the service industry. Here low quality or inefficient service can be a concern that is discussed in the light of probable causes such as physical evidence, place, service, people, production and quality, price, process, and production. The different causes in each category are then showcased as sub-branches.
Example 5: Manufacturing Fishbone Diagram
 Source:EdrawMax Online
In the context of manufacturing, the classic fishbone diagram example holds true every time. This is in context to the Ms such as machine, measurement, method and materials. These have further sub-branches such as measurement pertaining to accuracy, sampling, and bias whereas method would comprise of a recipe or operating process. This showcases how every subdivision of a certain category is looked into to determine how it contributes to a final cause.
4. Online Fishbone Diagram Maker
EdrawMax Online not just a fishbone diagram maker. Use EdrawMax online to create your fishbone diagram without efforts, just grab a fishbone diagram template or choose one fishbone diagram template from EdrawMax Template Gallery and keep customization as your preference, and your fishbone diagram is ready.
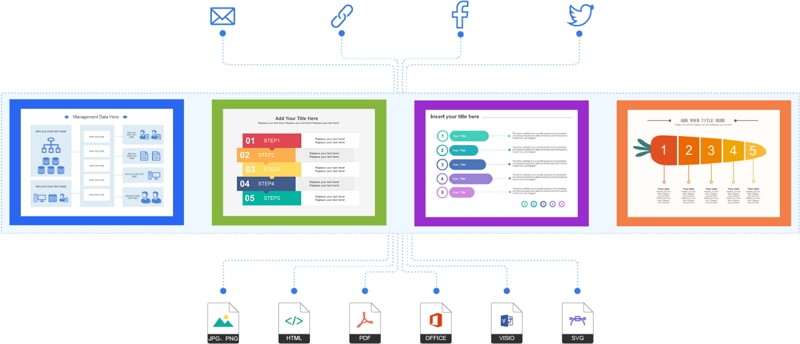
Our online fishbone diagram maker keeps your data safe and sound. EdrawMax's built-in feature can hide sensitive data and prevent unauthorized access. Except that, the substantial fishbone diagram symbols and templates make your creation easier and easier. Furthermore, it supports to export your file in multiple formats, such as Graphics, PDF, HTML, Visio and more.
Why Choose EdrawMax Online:
- Create over 280 diagram types
- Supports team collaboration
- Personal cloud & data protection
- Print, share and download
- Powerful template community
5. key Takeaways
Overall, we have provided detailed information concerning different fishbone diagram examples. Therefore, you have learned a lot and now know enough to create or read a fishbone diagram by yourself. But if you are still confused by making a fishbone diagram in EdrawMax online, here is a detailed fishbone diagram guide to lead you step by step.
If you are looking to create a fishbone diagram, the best place is EdrawMax Online. As evident from fishbone diagram examples discussed above, one can use such a tool to analyze different causes of a business problem and how to find solution for the same. With Edraw it becomes easy to draw up such illustrations with a professional finish.


