How to Make a Fishbone Diagram in 5 Minutes
Create a Fishbone Diagram on Edraw.AI Online Free Free Download Free Download Free Download Free DownloadWhat Is a Fishbone Diagram?
A Fishbone Diagram, a.k.a. Cause and Effect Diagram is used to identify the main causes of a problem in an organization or a system. Because a fishbone diagram helps organizations deeply analyze and find the root cause of an issue, it is sometimes referred to as the Root Cause Analysis diagram.

Image Source: Pixabay.com
Preparations for Drawing Fishbone Diagram
As the name suggests, a fishbone diagram is drawn following the structure of the skeleton of a fish. A few important elements that the diagram has included:
- An optional fish-shaped outline that gives a visual boundary while assessing the issue. This outline is light and is there to give a rough structure of a fish in order to keep the focus of the analysts on the main effect and its causes.
- A broad, long main arrow facing toward the right side with the main problem written at the mouth of the fish, i.e. at the end of the arrow. This arrow looks like a spine of the fish’s skeleton.
- A couple of branches coming out from the spine (main line of the arrow) of the structure. These branches are labeled with the categories of the issues that caused the effect.
- Several sub-branches coming out from each category. These sub-branches are labeled with issues that eventually resulted in the main problem.
Note: Sub-branches may also have further sub-sub-branches if need be. The point is, the more details are provided the easier it would be to analyze the root cause of the effect.
By the time you’re done drawing a fishbone diagram, the entire illustration will look like a complex skeleton of a fish. That said, make sure to label each element in the diagram as you create it to avoid any confusion or error.
How to Make a Fishbone Diagram?
Although you can draw a fishbone diagram on a sheet of paper or using any drawing software, EdrawMax Online offers a quick and easy way to do so. With a basic structure, important symbols, and pre-aligned text boxes, the portal lets you create a fishbone diagram within a few minutes.
You can follow the below steps to create a fishbone diagram using EdrawMax Online:
Launch your favorite web browser, go to https://www.edrawmax.com/online/, and sign in with your EdrawMax account. If you don’t have an account, create one and then sign in.
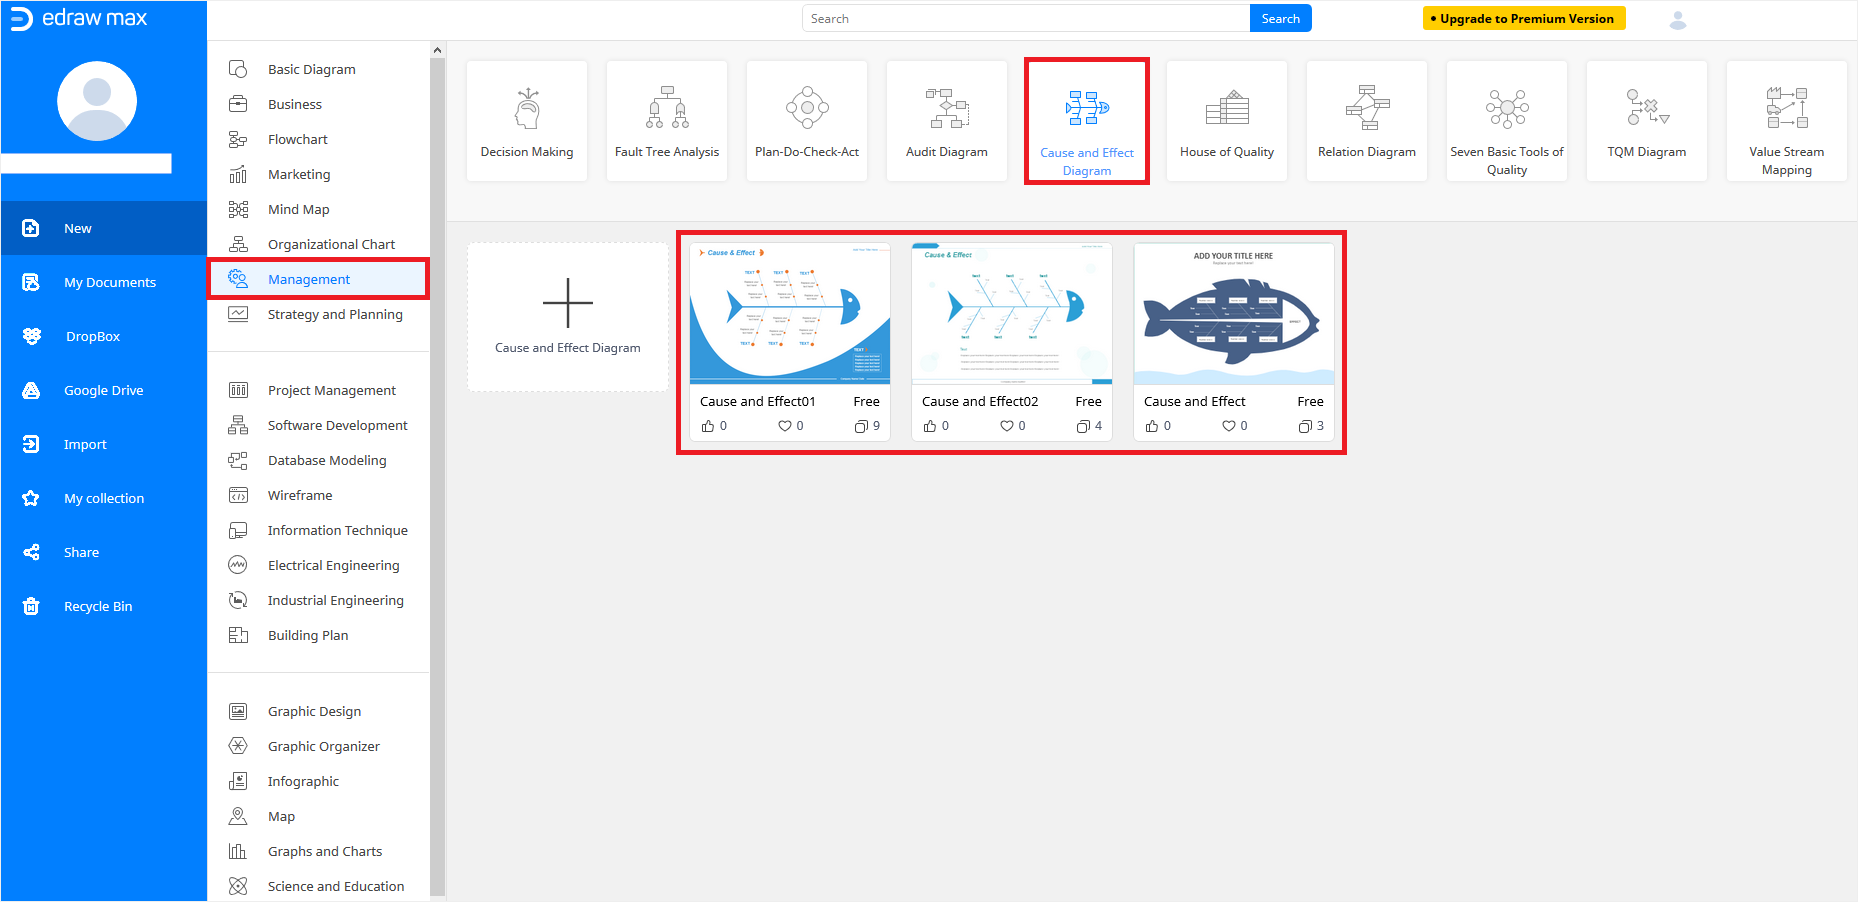
Click Management from the middle pane of the page, click the Cause and Effect Diagram button from the top and click your preferred fishbone diagram design from the available templates.
Alternatively, you can click the "+" button to open a new document and start creating your own fully tailored fishbone diagram using the symbols in the Symbol Library on the left.
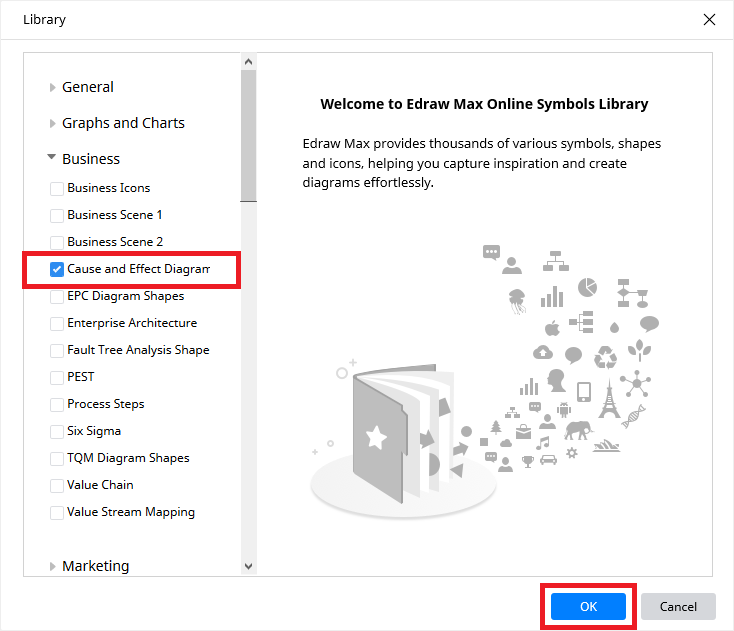
Note: If the Symbol Library doesn’t have symbols relevant to fishbone diagrams, you can click its name at the top, expand the Business category in the Library window, check the Cause and Effect Diagram box, and click OK.
Double-click the text placeholder at the fish mouth and type the problem that your organization is experiencing. Next, double-click the other text boxes and label the categories and branches with their relevant titles.
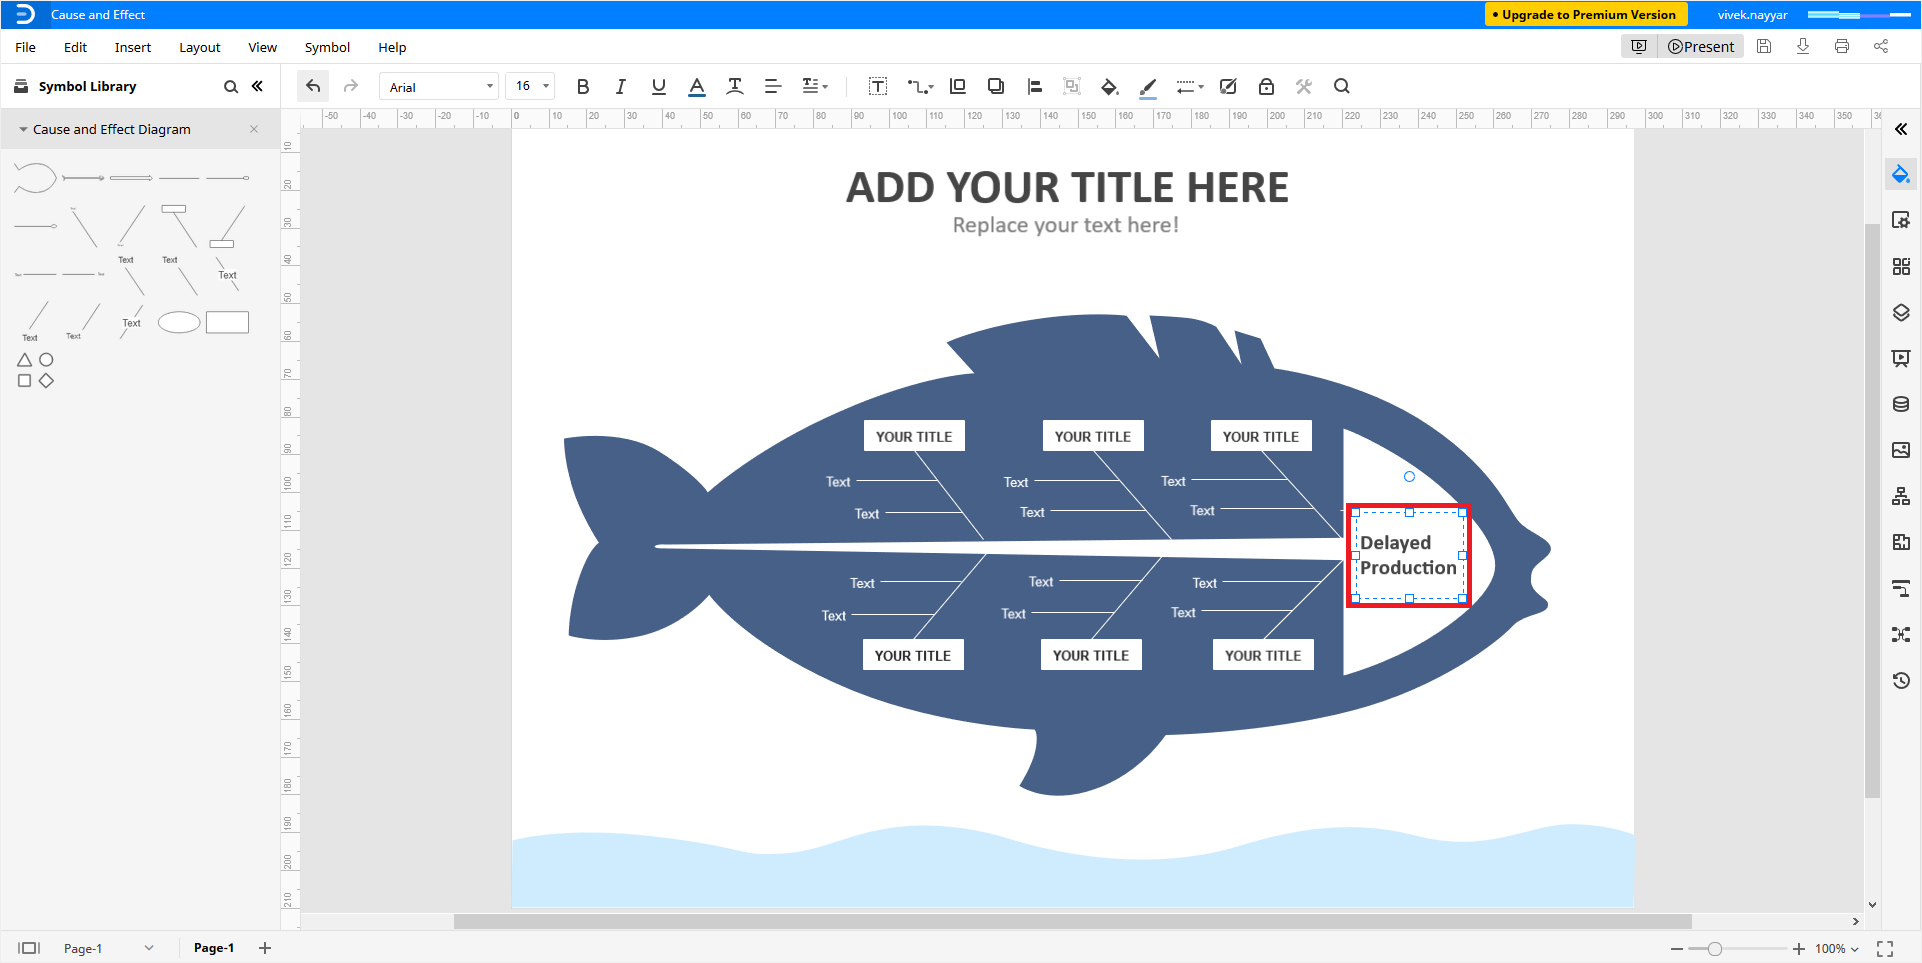
To add more categories and branches, you can double-click an appropriate symbol from the Symbol Library on the left.
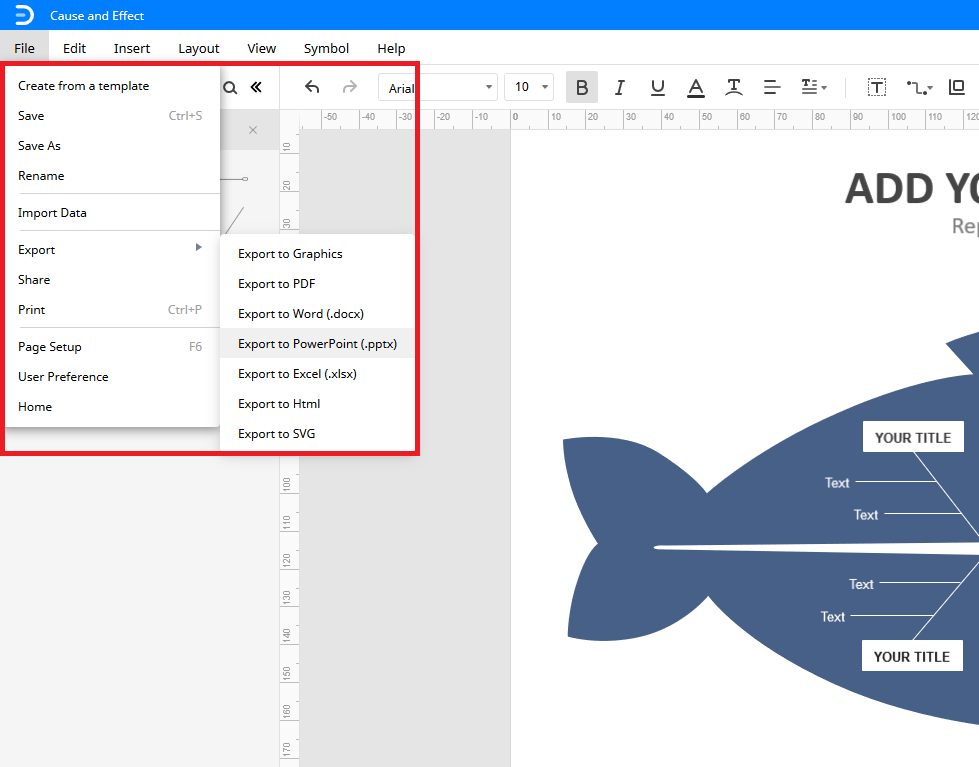
Click File from the menu bar at the top, and click Save As or Export to save your diagram to Google Drive/Dropbox cloud storage or export it as your preferred file format such as a PowerPoint, Word Document, PDF, or Scalable Vector Graphics (SVG) respectively.
More Fishbone Diagram Templates
In addition to those present under the Cause and Effect Diagram category, there are many other fishbone diagram templates that are made available by the developer and can be downloaded and used for free. Some of the most commonly used templates along with their download links are listed below:
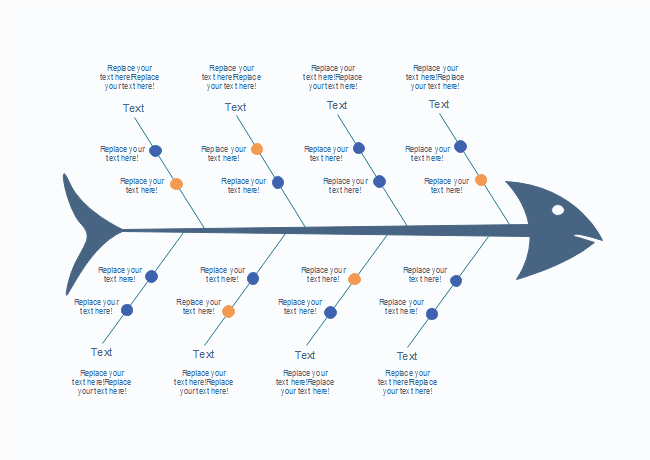
Node Fishbone Diagram Template
– This is a completely neutralized and generic fishbone diagram template that enables you to add your own text in the placeholders to illustrate the problem you are facing.
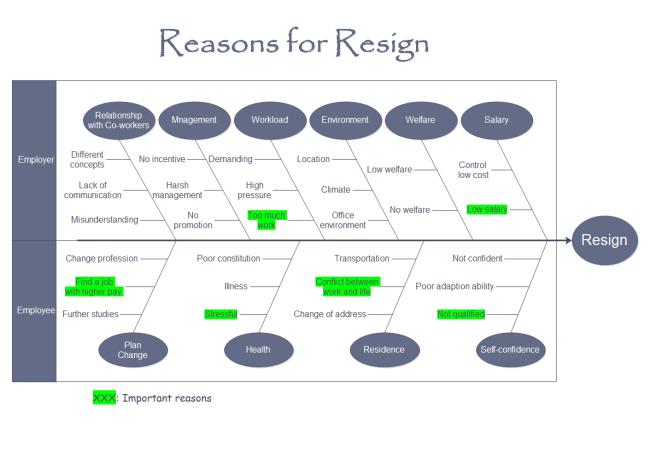
Resign Fishbone Diagram Template
– This template helps you assess the root cause behind the increased employees’ resignation rate in your organization.
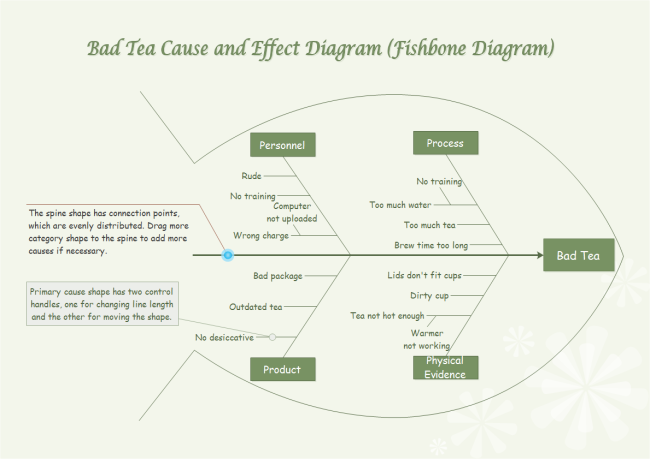
Bad Tea Cause and Effect Diagram Template
– If you are in a business of tea production and packaging and have recently discovered that there were some issues with bad tea, this fishbone diagram template lets you analyze the root causes of the problem.
Fishbone diagrams offer a unique way of narrowing down and locating the fundamental reason for the hard phase your company is going through. With a detailed diagram, it becomes easier to assess the source of the effect, and then take necessary actions to fix the loopholes to get everything back on track.


