Fishbone Diagram Complete Guide
Create a Fishbone Diagram on Edraw.AI Online Free Free Download Free Download Free Download Free DownloadWhat is a fishbone diagram?
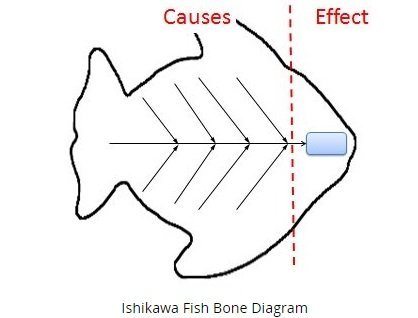
Image Source: project-management-skills.com
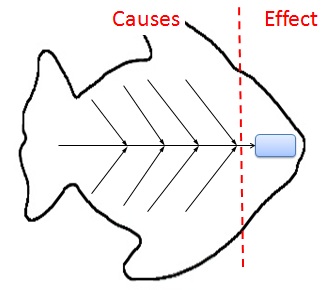
Ishikawa or fishbone diagram is one such diagram to detect the causes and effects of various imperfections, failures, or defects in the business. Managers mostly use the Ishikawa diagram or the cause and effect diagram as a tool in finding out the deviations that are necessary to detect for business expansion. The layout is similar to a fish's skeleton. It depicts the problem at the head and the causes at the spine. After all the issues have been identified using the Ishikawa diagram, the manager can take further steps to improve upon the situations.
So, you can also call it a beneficial tool in product development and problem-solving related to the product. If you go deep, the fishbone diagram also involves combining the practice of brainstorming with a kind of mind map template. Thus, for a beginner, it is crucial first to understand the basics of the fishbone diagram and then learn to draw it with the most consistent tool, EdrawMax.
Why use a fishbone diagram?
A fishbone diagram is used for troubleshooting and product development processes while focusing on the whole conversation. The description has been used since Dr. Kaoru Ishikawa, a quality control expert, invented it. His idea was to avoid solutions that will become the cause of even more significant problems.
Given below are some of the reasons to use the fishbone diagram.
The Fishbone diagram simultaneously shows the causes and problems within a set structure. The causes shown are the reasons for the main issues, which are further beneficial for in-depth analysis and to solve the problem in a better way.
This cause and effect diagram displays the necessary links, both rationally and publicly. These relationships will help the analyzer to understand the problem at a glance.
As a fishbone diagram captures all the possible causes, it also helps to structure and boost the brainstorming about their reasons.
The visual graphics of all the causes also assists in stimulating the team to find out the possible solutions to these problems. It will give a kick start for addressing the apparent reasons.
An Ishikawa diagram, while depicting all the causes in one place, helps the various team members to focus instead of wasting energy in nonexistent problems. It will further assist in achieving a common organizational goal.
Here are quick pointers to define the purpose of using a fishbone diagram.
- To identify weak areas or bottlenecks in a business process.
- To identify various causes of a business problem.
- To address product development based on the defects in current market offerings.
- To avoid burnout or recurring issues.
- To ensure that solutions taken will resolve the causes and issues arises within the diagram.
What is a fishbone diagram for?
Fishbone Diagram is a versatile diagram that can be used for solving various problems in manufacturing, marketing and sales processes. Let’s see how it can be used for different sectors as follows.
Fishbone Diagram for Manufacturing Problems
Keeping in mind the nature of fishbone diagram as a cause and effect diagram, it contains mainly 8 Ms as causes for which you have to define the effects or sub-causes.
The diagram given below will help you understand the manufacturing problem of a company by listing various effects. It is being shown separately for 6Ms as well as 8Ms.
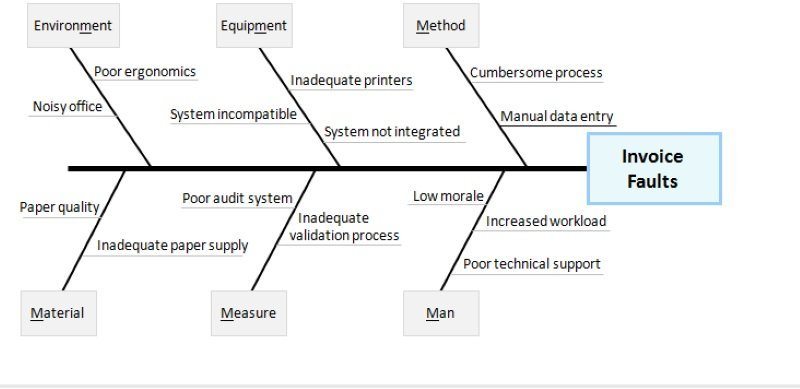
Image Source: pinimg.com
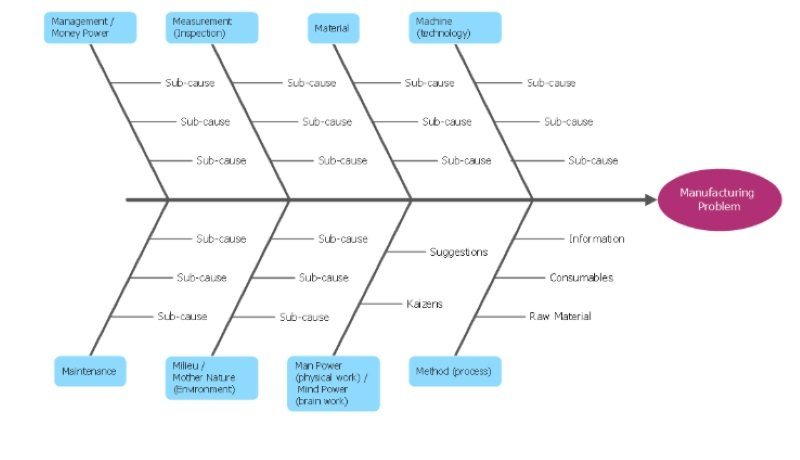
Image Source: pinimg.com
Fishbone Diagram for Marketing Problems
Marketing is another important area that can be benefitted from using fishbone diagram. The problems are usually hard to find in marketing sector that demands for the use of fishbone diagram for easy solutions and quick actions for downfalls.
There are mainly 7Ps that can be addressed in the diagram as follows.
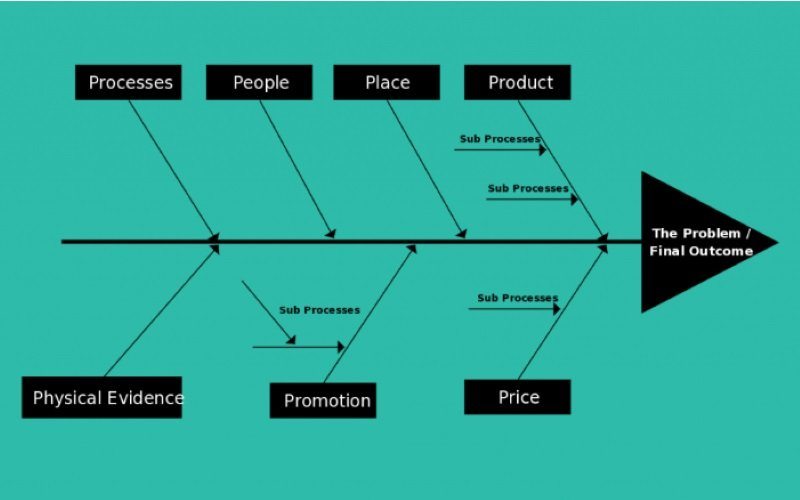
Image Source: cloudfront.net
Fishbone Diagram for Sales Problems
Sales is also a sub-part of marketing area to be addressed in the fishbone diagram by using mainly 5 Ss. Thus, similar to manufacturing and marketing, it also has a standard set of categories to be considered.
See the diagram below to understand how fishbone diagram is used for sales processes.
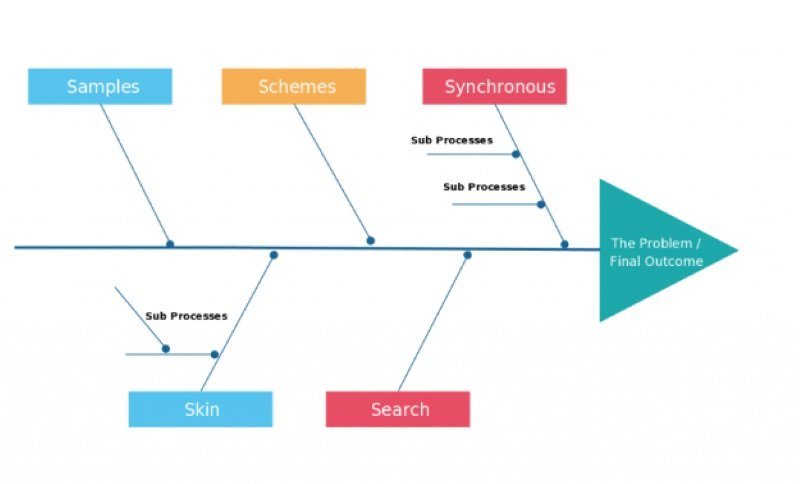
Image Source: cloudfront.net
Pros and Cons of Ishikawa diagram
In the section given below, you will get an insight into both the advantages and disadvantages of using a fishbone diagram.
- Identification of cause and effect relationships in various problems concerned.
- Comprehensive cause analysis.
- An objective look at origin as well as the development of specific issues.
- Operates via brainstorming sessions.
- Prioritizing vital causes in the diagram.
- Understanding of the contributing factors.
- Developing inclusive and superior risk controls.
- Complex interrelationships with multiple factors.
- Brainstorming often dependent on evidence and fact.
- Immaterial potential causes may get produced by brainstorming.
- You should combine it with another risk management tool for betterment.
- Not for use in reactive risk management activities.
- Do not take into account the failures in human behavior or any risk controls.
What does 5 Ms, 8 Ps, and 4 Ss mean?
These letters signify different uses in Management, Manufacturing, Marketing, and Service industry concerns. With regards to the 5 Ms, they are used as follows in the Ishikawa diagram.
The 5 M in fishbone diagram example in Manufacturing
- Method (Assembly line)
- Mother Nature (Ambient humidity problems)
- Man (Teaching a single employee to find the defect)
- Machine (Age)
- Materials (Hard materials)
It is commonly known as 6 Ms, including the Measurement also.
The 8 Ps used in the fishbone diagram example mainly for product marketing as follows.
- Product
- Place
- Price
- People
- Promotion
- Physical Evidence
- Process
- Performance
The 4 Ss used in the fishbone diagram example is mainly concerned for service industries.
- Suppliers
- Surroundings
- Systems
- Skills
Fishbone Diagram Example
We have managed to accumulate a fishbone diagram example to make you better understand the situation.
Here is a fishbone diagram example for the iron nails industry that is facing the issues of rusted nails getting set for delivery.
In the figure, the main problem of rusting is on the right side of the fishbone diagram. It is in terms of "Iron nails out of shape-Rusting."
Then, the main categories as per the manufacturing industry, along with the potential causes.
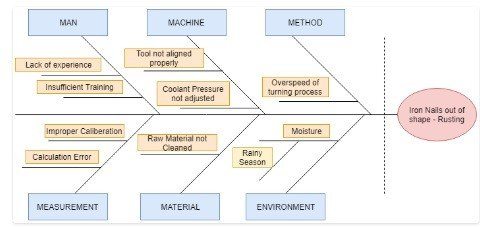
Image Source: amazonaws.com
This company has noticed a decrease in sales of 40% in June this year. They have taken into purpose the fishbone analysis for knowing the possible causes of the main problem.
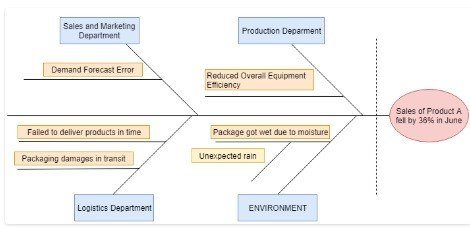
Image Source: amazonaws.com
After analysis, they have found that only one category of the Environment is used to cause the main problem. This category further consists of its cause as well as a sub-cause. The reason is that the package is getting wet due to moisture, whereas the sub-cause is the unexpected rain.
In this way, the company has succeeded in finding out a solution to this significant problem using the fishbone diagram analysis.
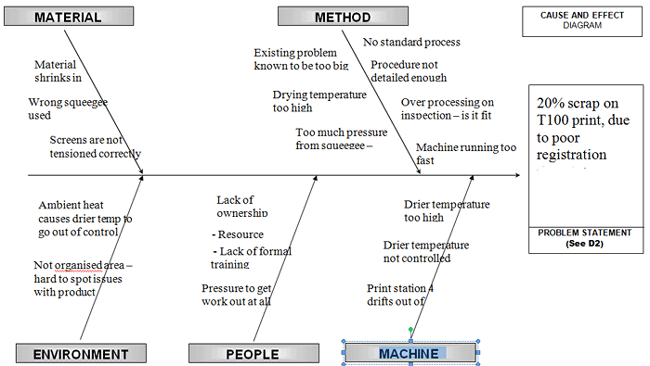
The fishbone diagram example given below is an indication of the excessive scrap problem faced by the persons in an industrial group.
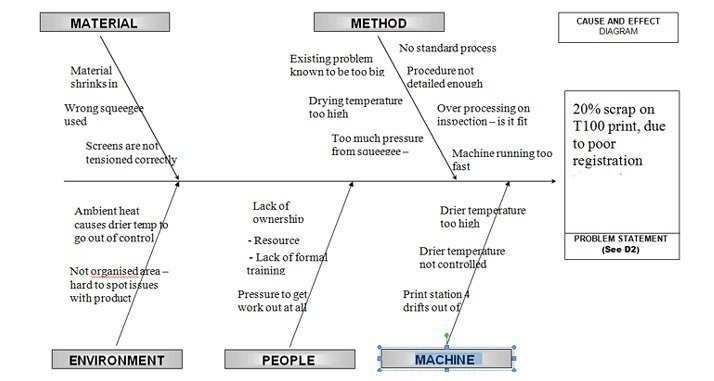
Image Source: educational-business-articles.com
How to create a cause and effect diagram with EdrawMax?
Creating a cause and effect diagram (fishbone diagram) involves using a similar structure of fish's skeleton as well as boxes for precise explanations.
Here is how you can prepare the best:
- You should know what you want to create. Hence, you may need to go through many rounds of preparation.
- Learn more about the software Edraw and take trials, do not worry if you fail in the beginning.
- Be confident of what you need and have a clear picture of the result that you want.
Now, follow the simple steps given below after launching the Edraw software tool.
Step 1: Start by selecting a template
There are massive inbuilt symbols and models in the Edraw software. The easiest way is to create a fishbone diagram by picking a fishbone diagram and edit it or choose a template and edit.
Step 2: Drag fish shape within the diagram
In the second step, from the cause and effect diagram, drag and drop the fishbone shape onto the left side at the canvas.
Step 3: Drag the rectangular Category 1 or Category 2 shapes onto the diagram
Now, drag the rectangular Category 1 or Category 2 shapes over the drawing page and position the arrowhead accordingly. To add text, double-click the shape.
Step 4: Represent the primary and secondary causes
To represent the primary causes, drag and drop the Primary Cause shapes over the drawing page and snap the arrowheads. While for representing the secondary causes, drag the secondary cause shapes over the drawing page.
In this way, your cause and effect diagram will get complete, which you can also export to various formats, including the PDF, Microsoft Office, and other graphic formats. Select ‘Export and Send' on the File menu for export options.
Tips for Creating a Fishbone Diagram
Study the following tips for creating a fishbone diagram.
- Encourage every person to participate in the activity of brainstorming.
- Use the diagram to maintain the focus of the team on the causes.
- To address the reason for each cause, use the ‘why’ technique, and you will get the answer.
- Always be sure of the categories for causes.
- Try to draw the fishbone diagram on a dry erase board or a flip chart. However, using tools such as Edraw will not let you make any mistake.


