Free Editable Circular Flow Diagram Examples
The circular flow chart analyses various agents' relationships in an economic scenario regarding the connections' factors. Several inputs and outputs present in an economic system that describes a circular flow diagram's complex shape. Investors and economists can use these charts to create a model to show the interconnections between the factors.
1. What is the Circular Flow Diagram
The circular flow diagram is a model that traces the inter-connection between the various elements of the economy. This model shows the flow of money and goods that flow between two parts. For example, the money flows from household to firm as the family is availing a service. This sort of circular flow chart shows the route of money in the economy. It helps in determining the condition of the economy for maintaining stability.
2. The Circular Flow Diagram Examples
There can be several forms of circular flow charts. The users can have a look at the examples to get a better idea about the circular flow diagrams:
|
|
|
| Circular Flow Diagram | Economics Circular Flow | Circular Flow Model |
|
|
|
| Circular Flow of Income | Simple Circular Flow Model | Circular Flow Chart |
|
|
|
| Econ Circular Flow Model | Brand Strategy Circular Flow | Data Circular Flow Diagram |
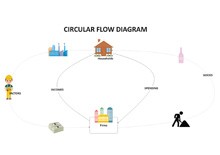
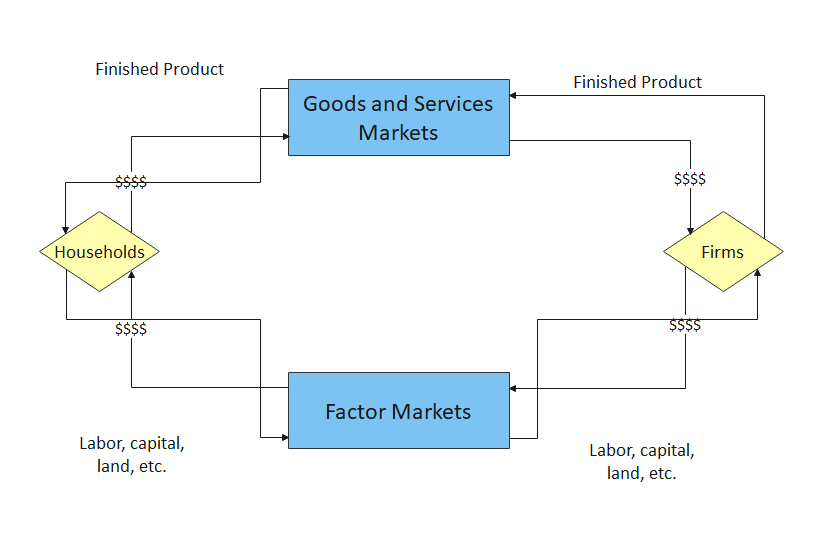
Example 1: Circular Flow Diagram
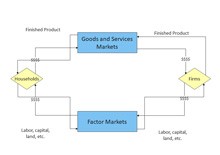
Here is an example of a basic model that shows the double-way flow of household incomes to goods and services markets to purchase certain products. There are two types of markets, markets for goods and services and markets for factors of production. The money flows from households to firms through the goods and services markets, and in the same way, a finished product is reaching the household through the market. It shows the relation between a buyer and a seller.
 Source:EdrawMax Online
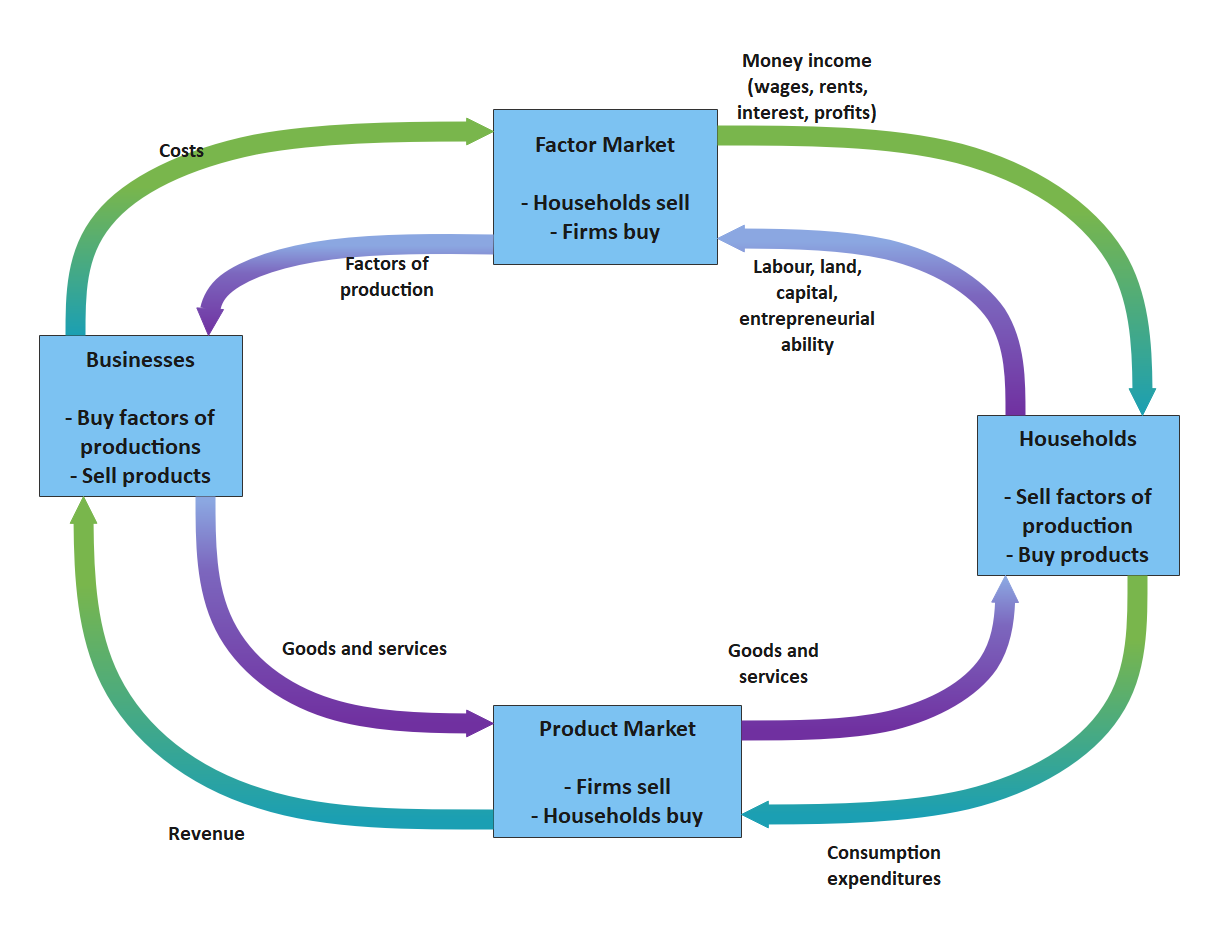
Example 2: Economics Circular Flow Diagram
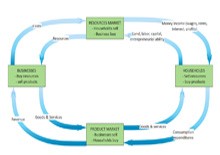
The circular flow chart also explains how money flows in the economy. Though there are many elements present in the economy, a circular flow diagram between a household and business firms can provide a glimpse of the more significant scenario. In the example, the circular flow chart shows how the business offers goods and services to households through product markets. The households become the supplier of labor, land, and capital for the business through factor markets.
EdrawMax has similar diagrams like this.
 Source:EdrawMax Online
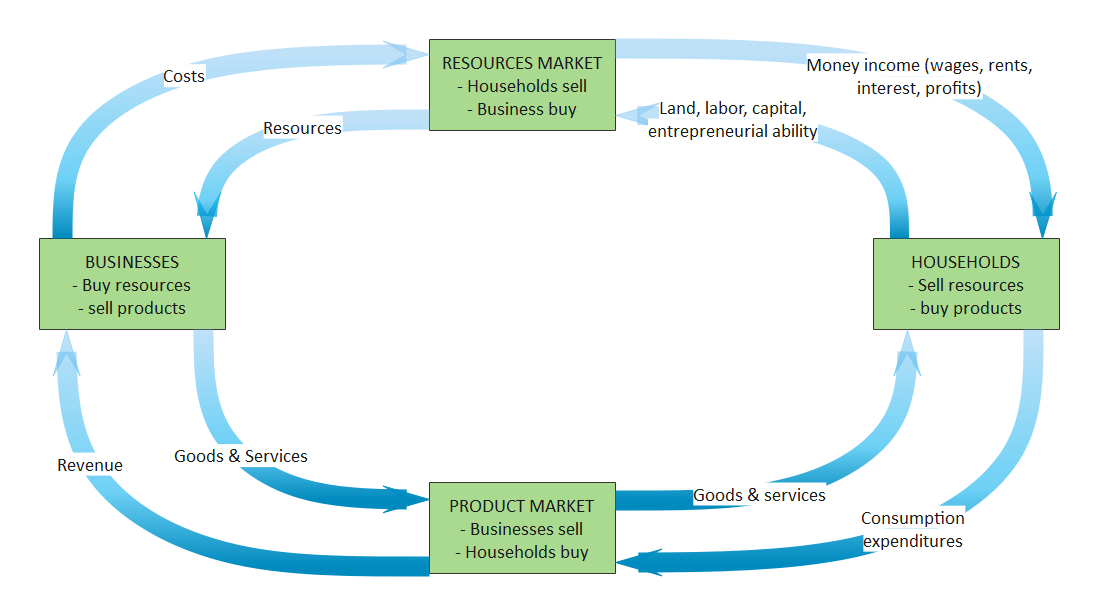
Example 3: Circular Flow Model
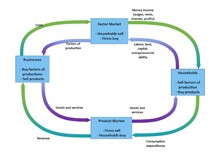
Here is another example that shows the flow of money and products in the economy. The business that generates the products and services supplies them to the households while the households provide those businesses with the business's basic requirements like labor, land. The household's expenditure for availing a service goes back to the household itself as a form of rent or wages.
 Source:EdrawMax Online
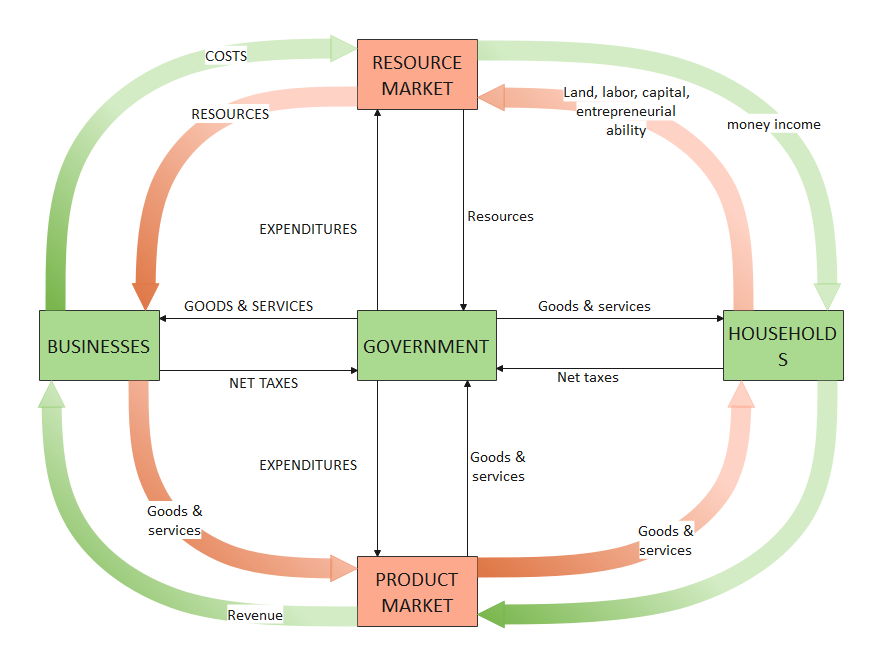
Example 4: Circular Flow of Income
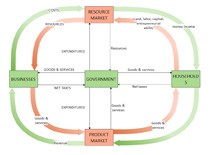
The actual economic scenario involves the government and the government present at the circular flow chart center. The flow of capital and labor supply from the household gets circulated to the businesses that provide various services and goods to the households. The service price goes back to households in the form of rents, wages, and more. The government is present in the middle who gets the taxes from both households and businesses, keeping this basic structure intact.
 Source:EdrawMax Online
Example 5: Simple Circular Flow Model
Here is an example of a circular flow diagram that shows the interrelation between government factors, households, and firms. The taxes and other government-owned factors get back to the government, and a part of it gets back to the businesses and households through the services and other expenditures of the government. The circular flow diagram also explains the relation between the product market and the factor market.
 Source:EdrawMax Online
Example 6: Circular Flow Chart
A circular flow chart explains how the movement of money occurs in a cyclic motion. The given flow chart example shows how the money circulates from a household to the business and firms. Similarly, there are certainly other factors like capitals that the household offers to the firms, and in return, they get services or products. This circular flow chart shows the economic connection between two various sectors of the economy.
 Source:EdrawMax Online
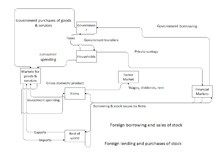
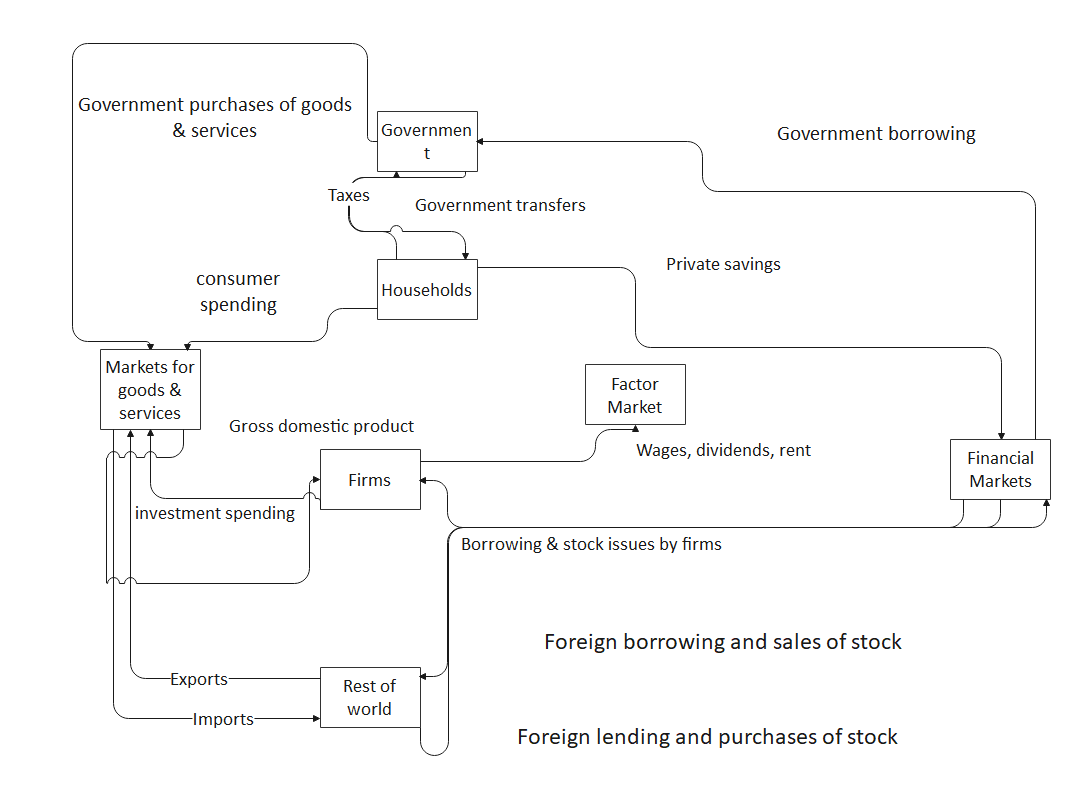
Example 7: Econ Circular Flow Model
Using a circular flow chart explains the relationship between various sectors of the economy in terms of money. It shows how money, products, services, and other things get circulated from one economic agent to another. The circular chart data shows the flow between the national accounts, overseas sectors, and firms. It also keeps the macroeconomics flow in the macroeconomics intact.
 Source:EdrawMax Online
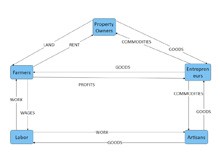
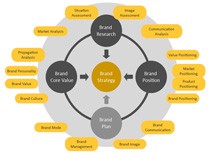
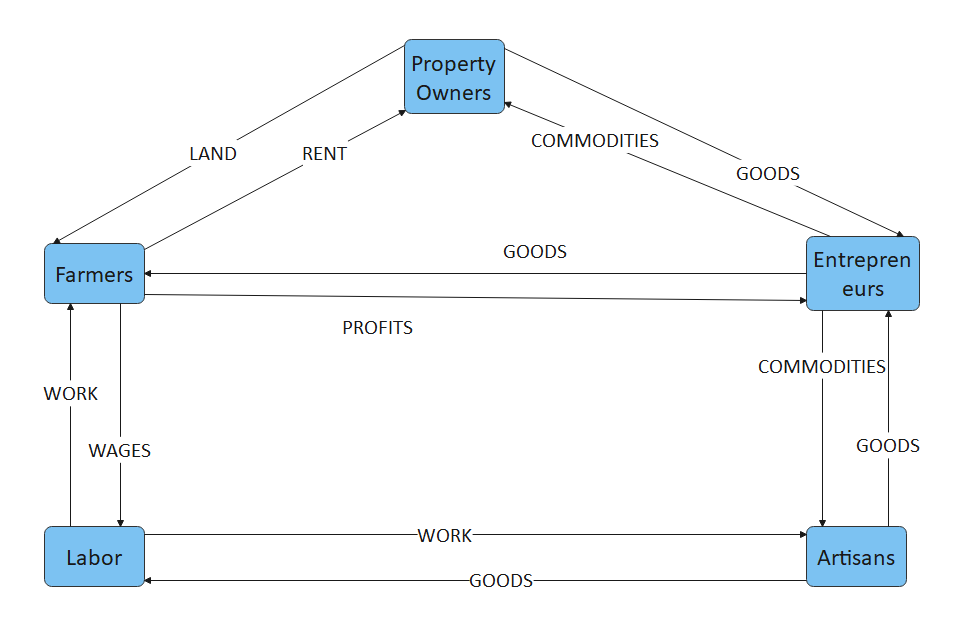
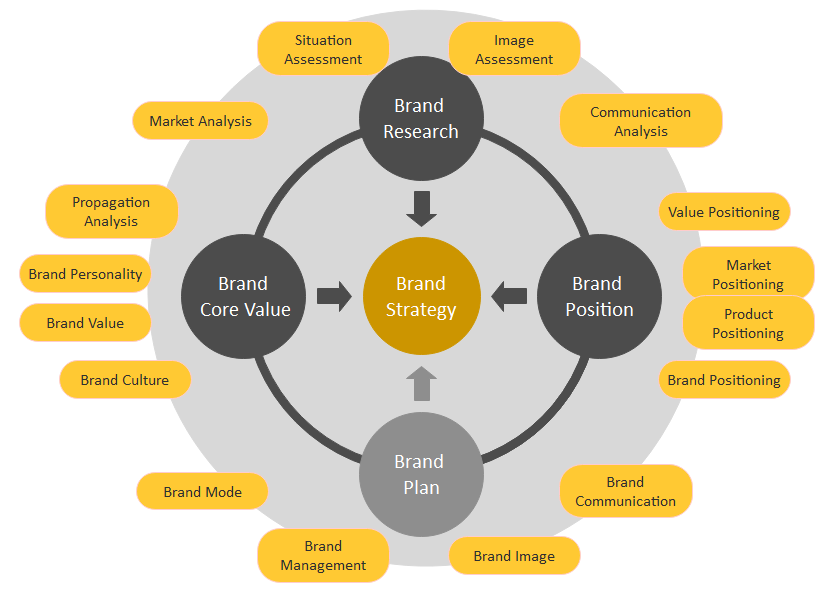
Example 8: Brand Strategy Circular Flow
As the relationship between firms and households, individuals can have a relationship based on their possession or occupation. In the given example of the circular flow chart diagram, there is a relationship between different occupations. The landowner provides the land and gets back some as rent, while the farmer gets his amount back through works and goods. Similarly, all the chart agents are giving and getting simultaneously, explaining the circular motion of money in the economy.
 Source:EdrawMax Online
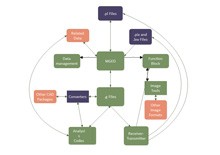
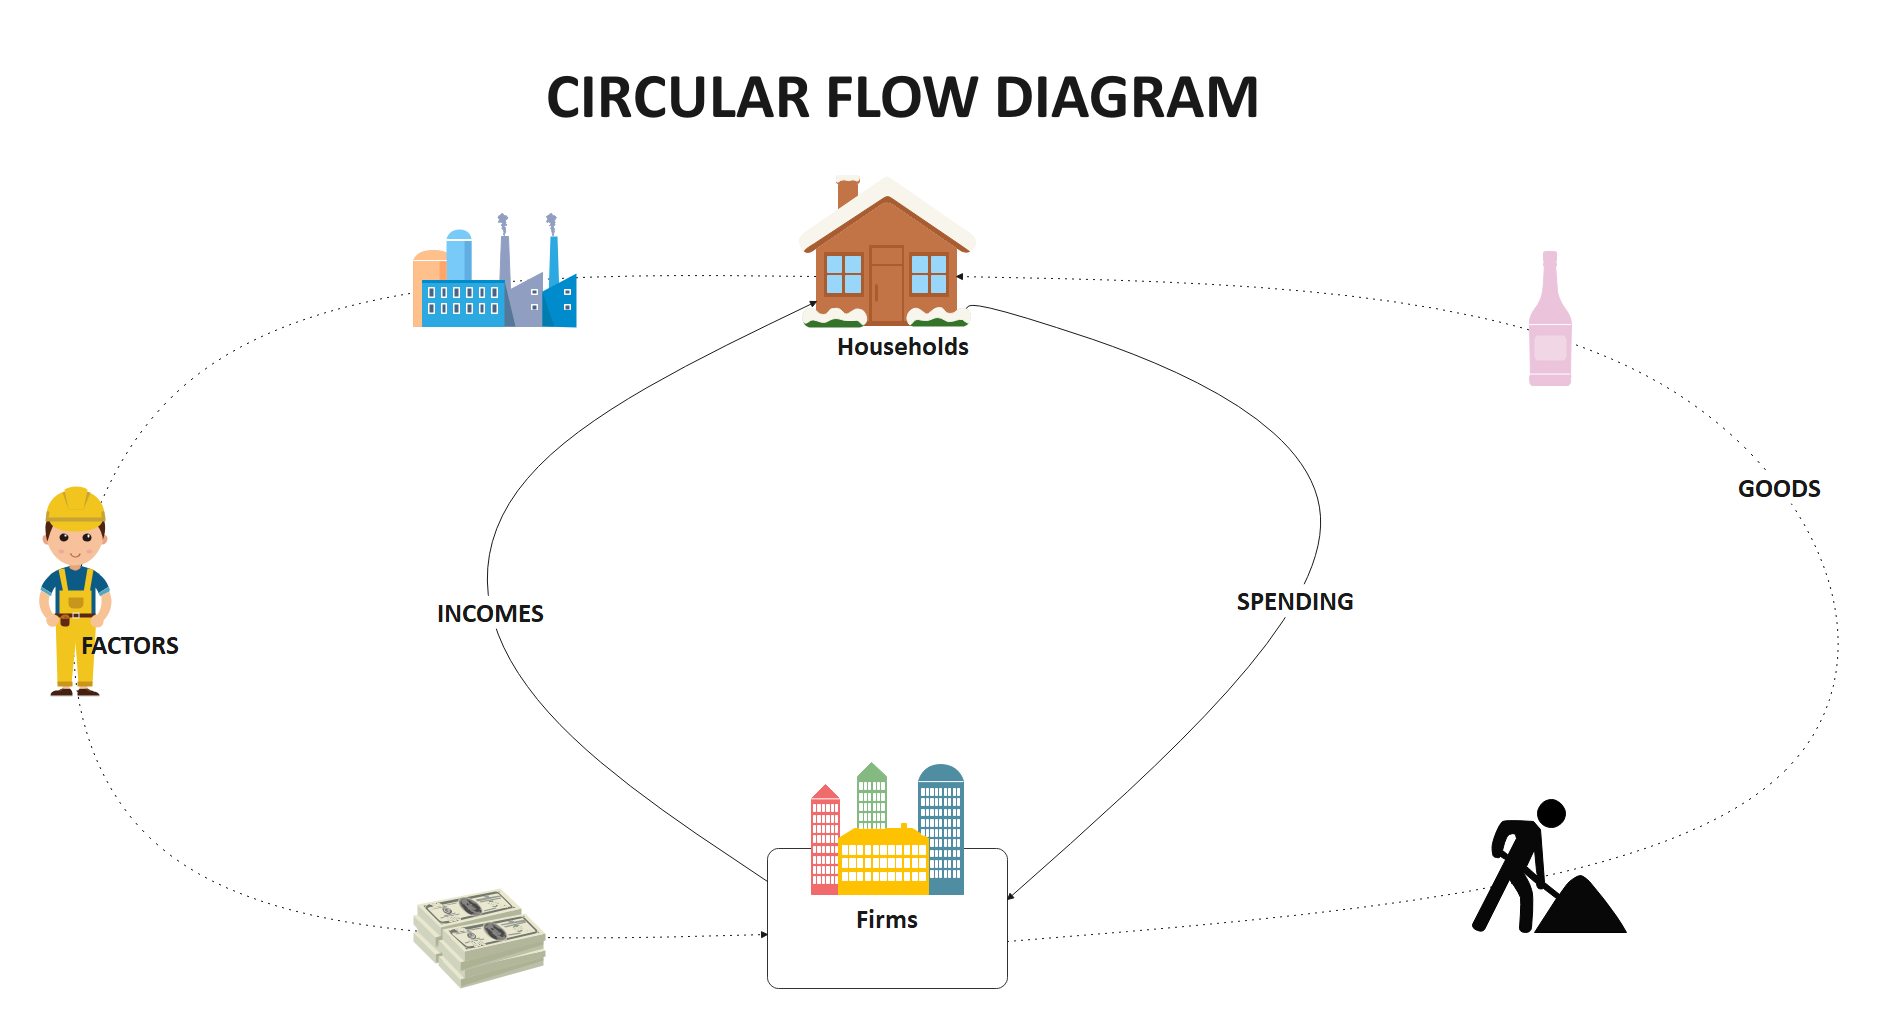
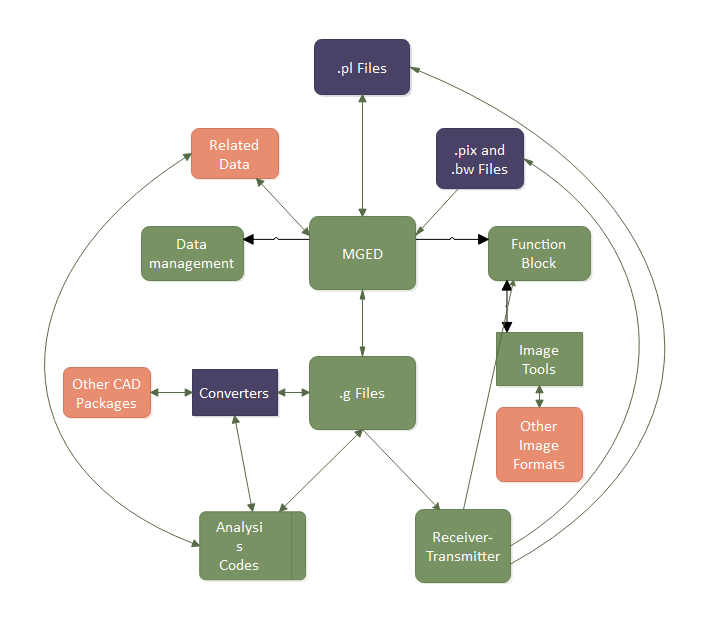
Example 9: Data Circular Flow Diagram
A circular flow chart is also an expression of relative inputs and outfits. Since the flow is circular with the change of agents, the inputs and outputs also change. Here is an example that shows the inputs and outputs for the two agents. The household supplies land and labor to firms through the factor market and gets back money income while the firms get a price for delivering products and services.
 Source:EdrawMax Online
3. Online Circular Flow Diagram Maker
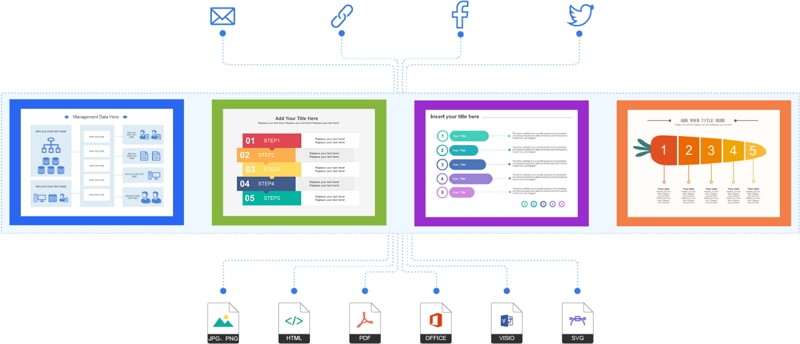
Since the construction of these circular flow charts includes several numbers of elements with different types of relations, many users may find it complicated. They can take the help of online tools to make the job easier. EdrawMax is one of the best tools when it comes to the drawing of circular flow charts. They have features like templates, resource centers, preloaded symbols. These make it one of the user-friendly and widely used online tools.
EdrawMax Online not just an online circular flow diagram designer. Use EdrawMax online to create your circular flow diagrams without efforts, just grab a template or choose one circular flow diagram template from EdrawMax Template Gallery and keep customization as your preference.
Why Choose EdrawMax Online
- Create over 280 diagram types
- Supports team collaboration
- Personal cloud & data protection
- Print, share and download
- Powerful template community
4. Key Takeaways
As the circular flow diagrams explain the endless flow of money and goods, services make it easier to construct a flowchart to show the interrelation between various elements with circular flow chart diagrams. The flow chart diagrams can explain the model of government income as well as that of a firm. It increases its relevance as a widely used flow chart diagram. There are different types of circular flow charts, and hence may sound complicated. The users can use the EdrawMax Online for a hassle-free experience.


