Free Editable Timeline Examples
Timeline charts help in tracking down some events in chronological order. The students and company owners widely use those timeline charts for their work. There are various timeline examples so that the users can check the timeline examples for guidance.
1. What is A Timeline
When a user uses a chain of events to define an event's course, the chart is known as the timeline chart. The users can use the timeline charts to denote the company's progress, develop a company, and expand an organization. The company owners can help these timeline charts track down their progress and plan for the future. These charts use eye-catching diagrams, symbols, and lines to create timeline charts.
2. The Timeline Examples
There are different types of timeline examples that the users can use for various purposes. The business owners and students can look at these timeline examples for references, and timelines will help people to remember and record milestones effectively.
|
|
|
| Timeline Example | Timeline Template | Blank Timeline |
|
|
|
| Maps Timeline | Generation Timeline | History Timeline |
|
|
|
| Project Timeline | Office Timeline | Business Timeline Example |
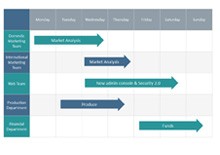
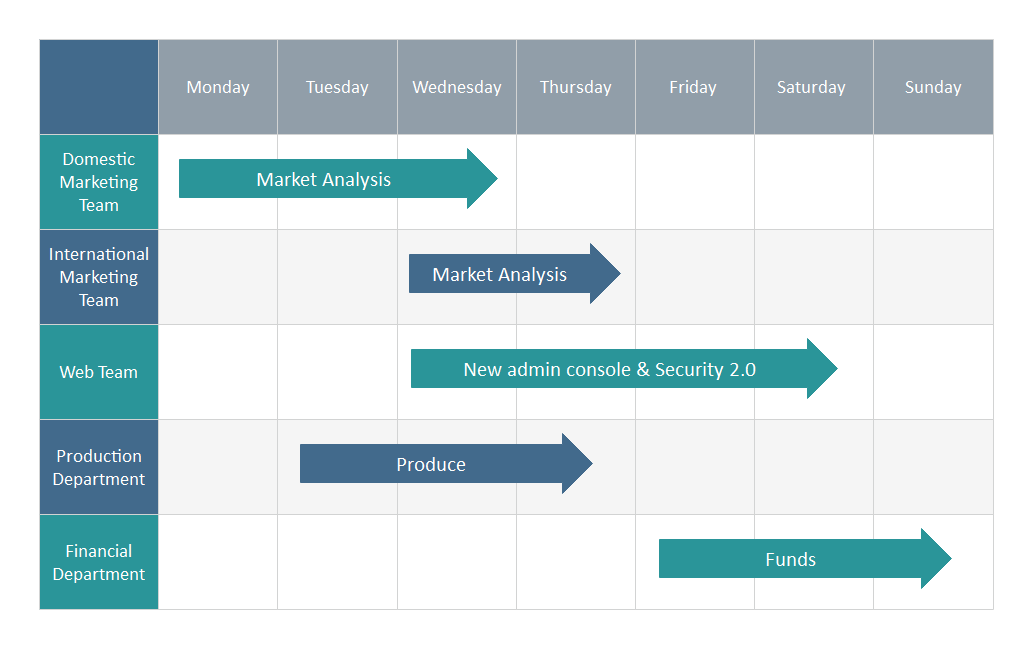
Example 1: Timeline Example
A timeline chart shows the flow of incidents based on their occurrence. A timeline helps the user to have an idea about the chronology of various events of a whole process. The students may use it to memorize the timeline of the historical incidents. Here is a timeline example that shows how the production in a company works. There are stages like market research to be conducted in domestic and international markets, production, funds, and more. It helps the company manager to have an idea about the work's progress, and they can also get to know at what stage the work is at the time.
 Source:EdrawMax Online
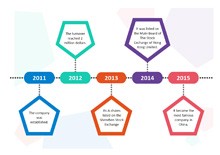
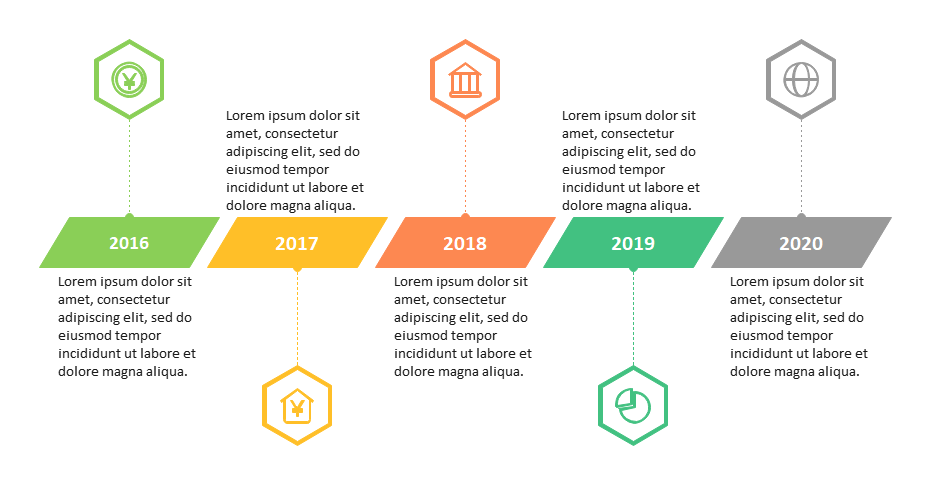
Example 2: Timeline Template
A timeline allows the user to know about the various important events and their time. The charts use different graphical symbols, tables, diagrams, and text to show the relationship between separate incidents based on time. In the given timeline example, there are some years written on a dotted line. These years are essential for the company, and the chart also shows the briefs of the events. It allows the users to understand the future growth of the company.
 Source:EdrawMax Online
Example 3: Blank Timeline
For scientific experiments, the researchers or scientists need to know about a precise chronology of the incidents occurring during the process. Simultaneously, the experiments and discoveries develop with time, and a timeline chart can be the best way to have an idea about those developments. The researchers or scientists working on the discovery can track down its progress with a timeline chart. Here is a timeline chart timeline example that shows the development with the timeline.
 Source:EdrawMax Online
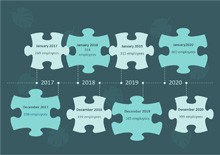
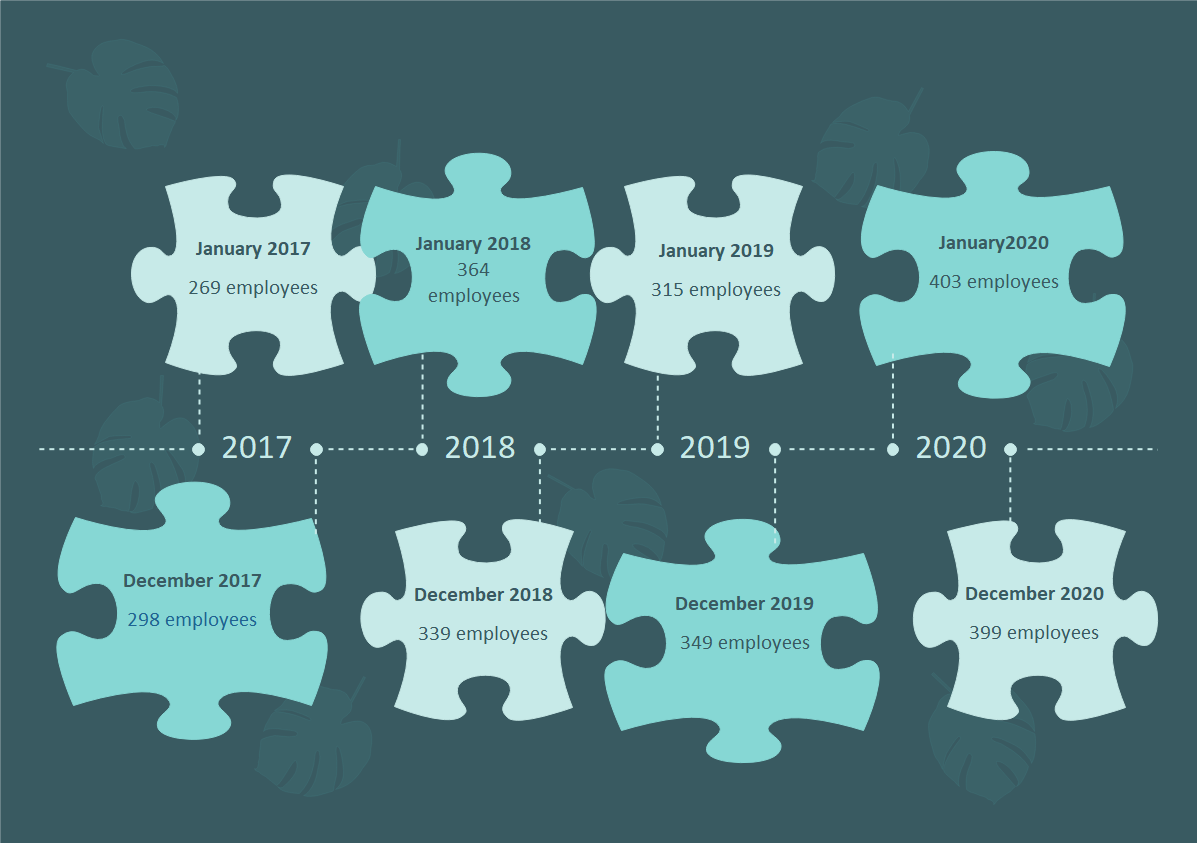
Example 4: Maps Timeline
The growth of the company is often equivalent to the number of people who are working with them. Thus, many companies tend to keep a record of their employees. They can maintain a timeline chart to show people's growth, which is the organization's growth. In the given timeline example, there is a timeline chart that shows the increase in the number of employees throughout the years.
 Source:EdrawMax Online
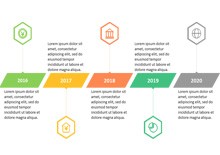
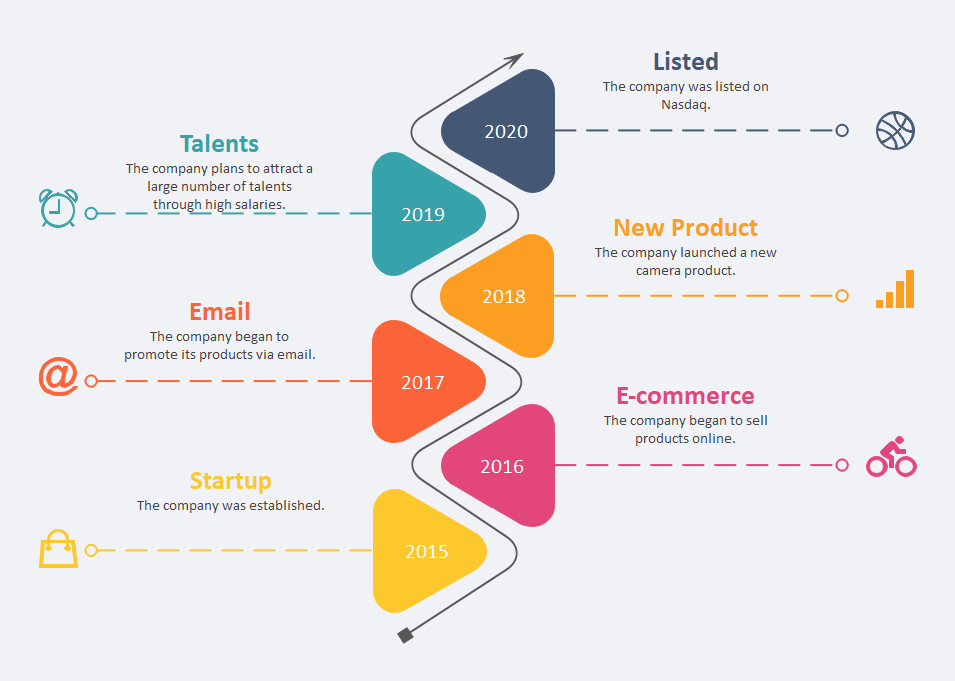
Example 5: Generation Timeline
A company gradually experiences growth, and it can also track down its development with time. It helps them know how effectively the company has worked on its expansion throughout the years, and at the same time, the company can also estimate its potential to grow. Here is a timeline example that shows how a company begins its journey by promoting through emails, and with gradual progress, they end up launching their new products.
 Source:EdrawMax Online
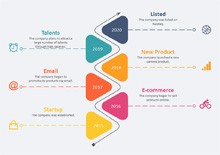
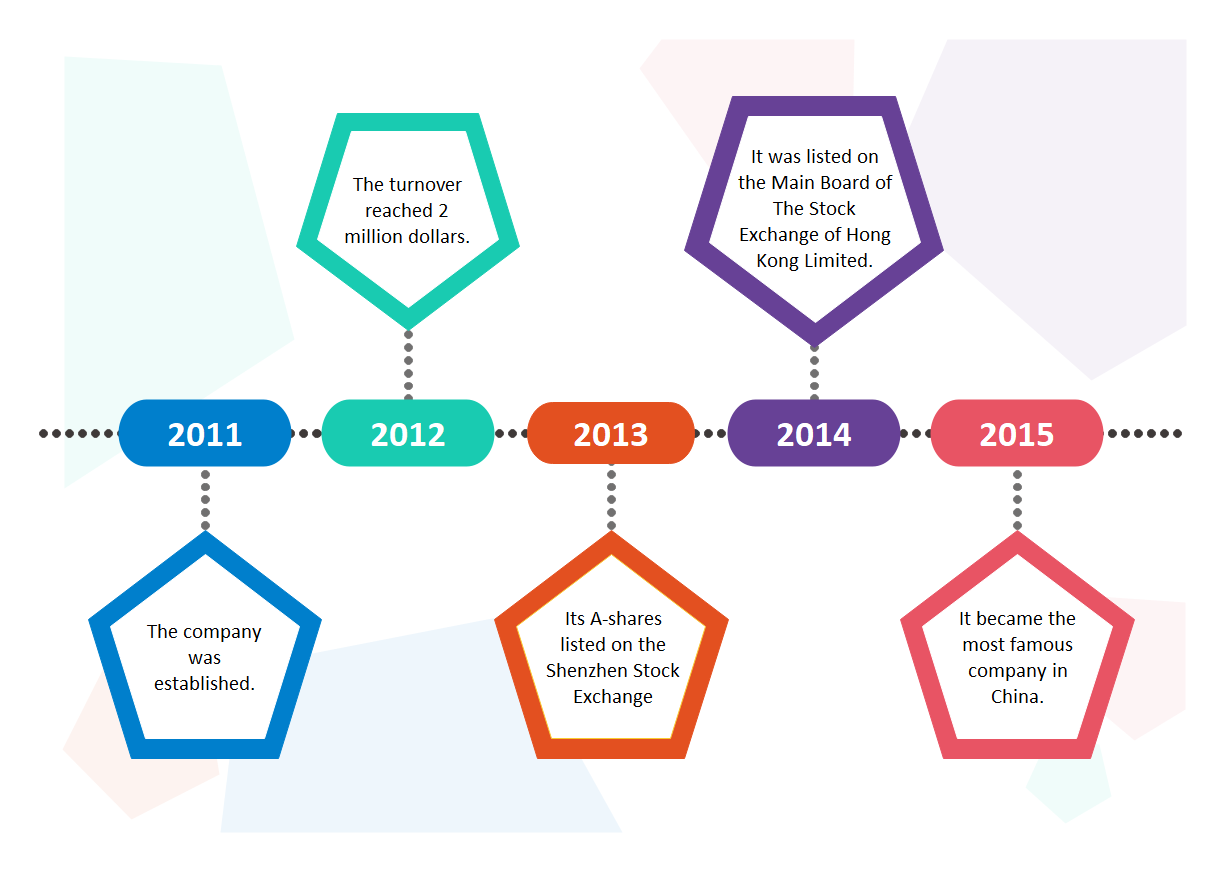
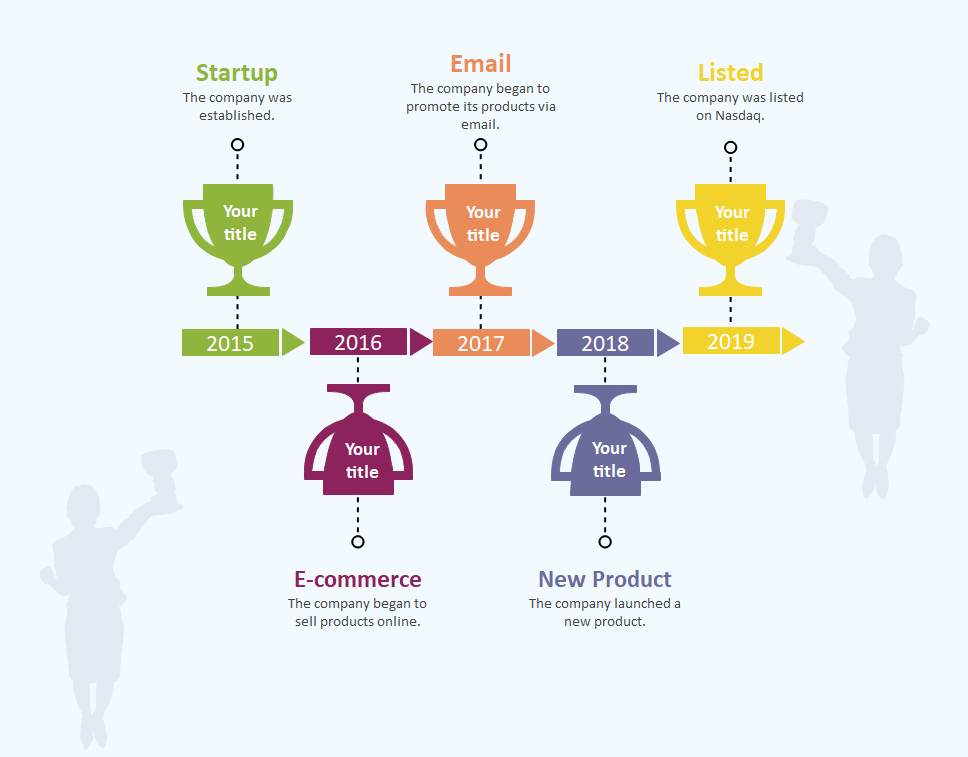
Example 6: History Timeline
Any corporate house can track down its growth through a timeline chart. Organizations, corporates, and companies need to keep a proper record of their transition to know how much the company can grow in the future. Here is a timeline example that shows the development of the corporate house. The startup begins in 2015 and continues to grow till 2021. Moreover, the company has used a graphical representation to show its growth through various steps.
 Source:EdrawMax Online
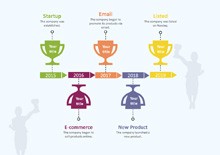
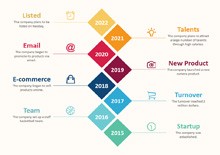
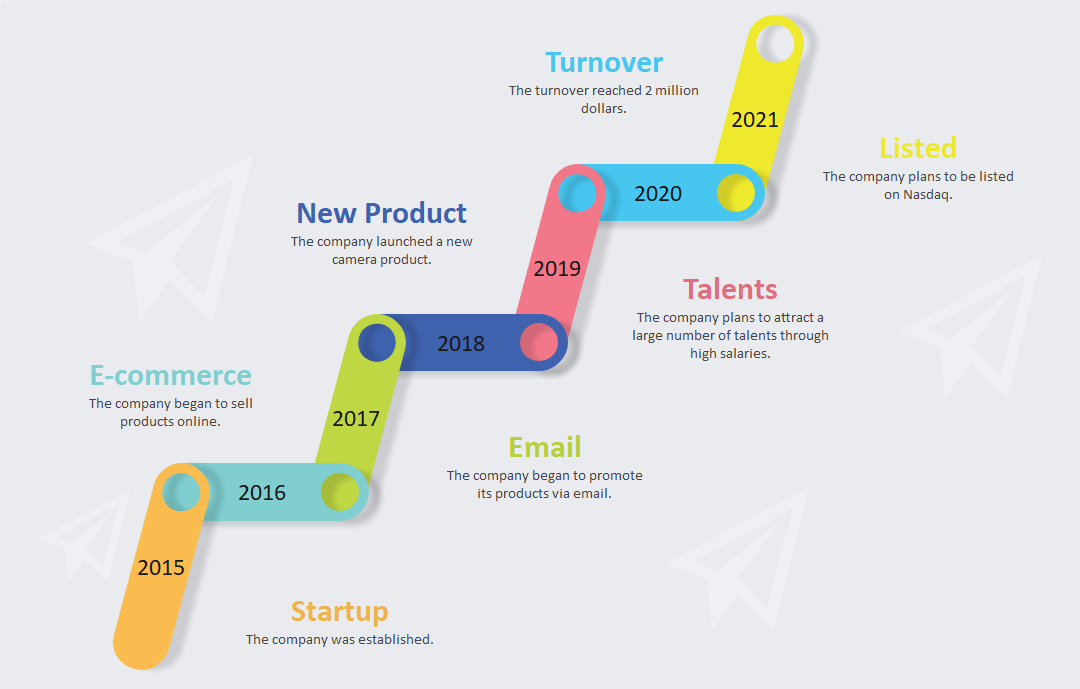
Example 7: Project Timeline
The companies can use graphical or chart representation to show the timeline of their various activities that they consider as their important milestones. The startup began in 2015 and then continued to grow through e-commerce, email promotions, new product launch, recruitments, and listing in Nasdaq. Any company can record their growth throughout the years using this timeline chart, which helps them have a broad prospect of their growth.
 Source:EdrawMax Online
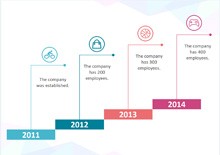
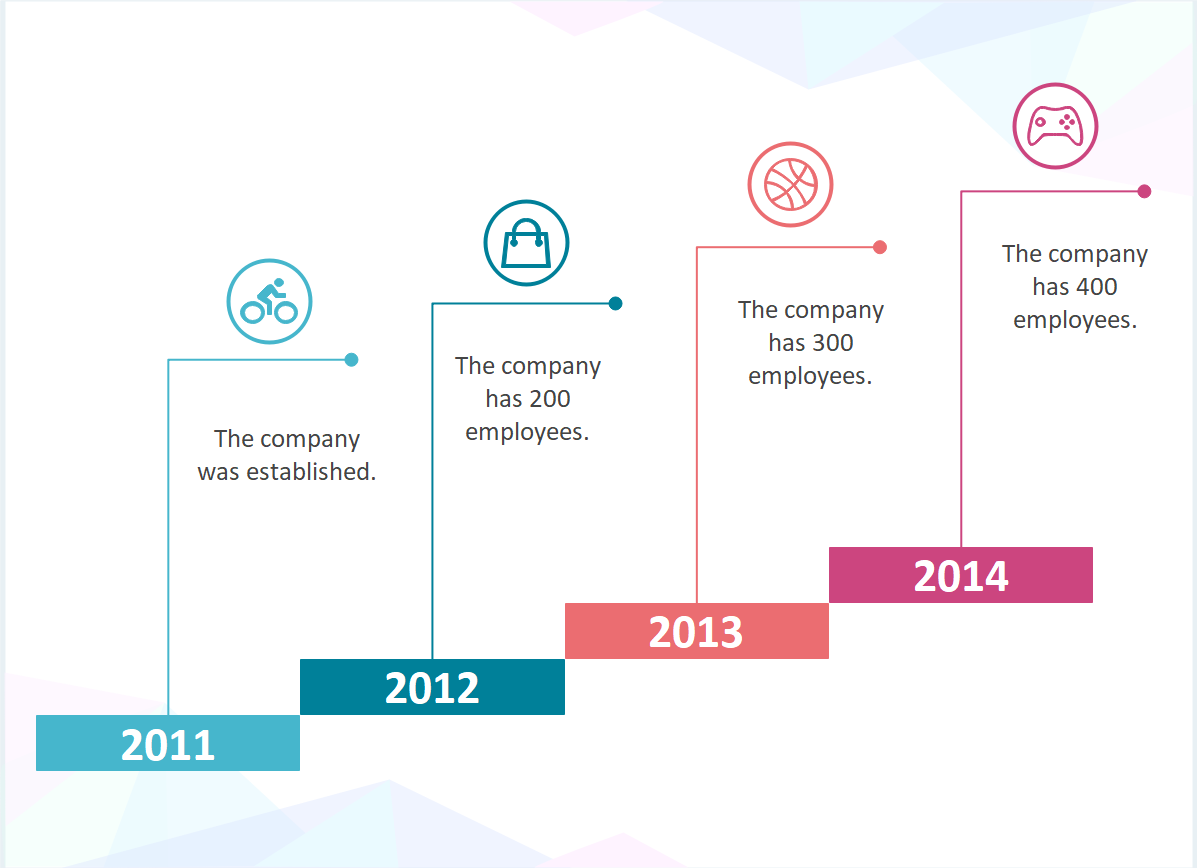
Example 8: Office Timeline
A company can consider various elements as indicators of its growth. Many companies may consider their reach to people as their indicator of growth, while many may think increasing numbers of employees signify their progress. Here is a timeline example that shows the development of a developing company. A company started in 2011 and then continued to grow till 2014. Throughout those years, they could increase their employee numbers from 200 to 400.
 Source:EdrawMax Online
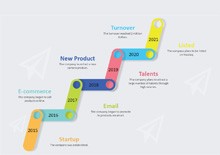
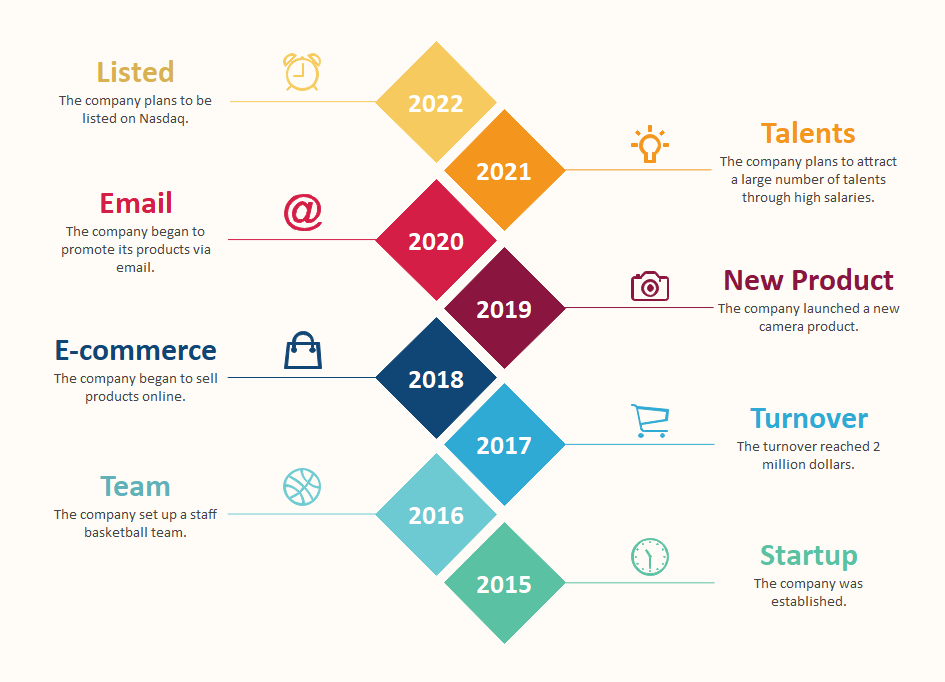
Example 9: Business Timeline Example
When a company plans its future events, it can also consider its past events, which signify its expansion. It is beneficial for business organizations to plan events. There are various stages of development for the company from 2015 to 2022. In 2015, there were multiple steps like team building, turnover gain, e-commerce management, new product launch, email promotion, and further recruitment that helped the company grow. The company has included their step in 2022 when they will get listed on Nasdaq.
 Source:EdrawMax Online
3. Online Timeline Maker
The companies can efficiently work their timeline charts. It is effortless to make a timeline chart, and the owners can use timeline maker to work on a timeline chart. They can use user-friendly tools like EdrawMax, which gives them a comfortable experience. The tool has some easy templates that the user can work with for their chart. The tool also comes with a resource center that the users can content if they have any problem with their work.
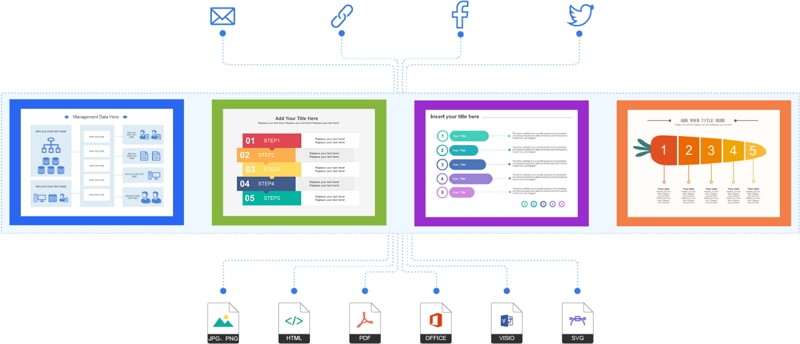
EdrawMax Online not just an online timeline designer. Use EdrawMax online to create your timelines without efforts, just grab a template or choose one Timeline template from EdrawMax Template Gallery and keep customization as your preference.
Why Choose EdrawMax Online
- Create over 280 diagram types
- Supports team collaboration
- Personal cloud & data protection
- Print, share and download
- Powerful template community
4. Key Takeaways
The companies and organizations can use the timeline examples as it helps them to plan their future steps. The students and researchers can also take the help of timeline charts for learning purposes. The users can work on EdrawMax for a user-friendly experience. The tool allows inexperienced users to work on their charts with the help of timeline examples . If you still confused about how to make timeline in EdrawMax Online, here is an timeline guide to help you create plans in minutes.


