Data Flow Diagram Symbols and Meanings
1. Data Flow Diagram 101: Covering the Basics
In nutshell, data flow diagrams simply provide a visual representation of how data is handled in a system. The diagrams are commonly used in software engineering and analysis as they can provide a multi-level representation of data and its overall processing.
In most cases, they provide the logical representation and processing of data by different components of a system. Apart from its processing, details about its storage, input, and output are also included in DFDs. Therefore, data flow diagrams can be used in the following way:
- To provide the logical flow of information in a system.
- To depict details about the physical connectivity and streaming of data.
- It is also used to represent the network connectivity of data in a system.
- It helps us understand the scalability of the system so that we can improve its functionality.
- Other benefits include a stepwise refinement of the system and learning the behavior of various components.
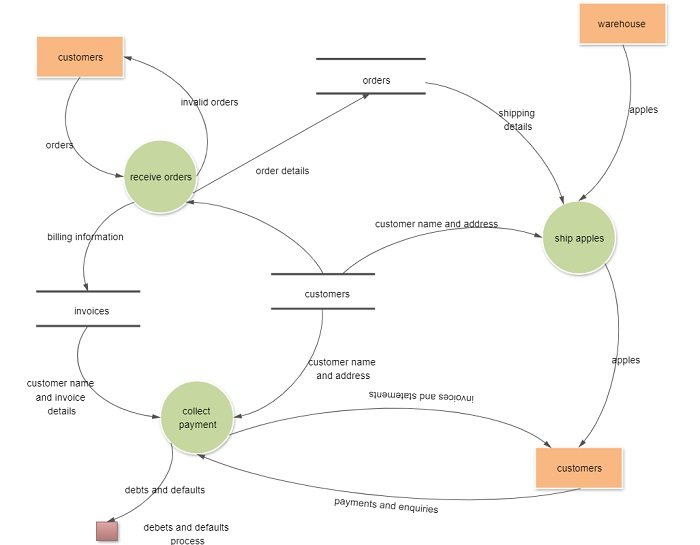
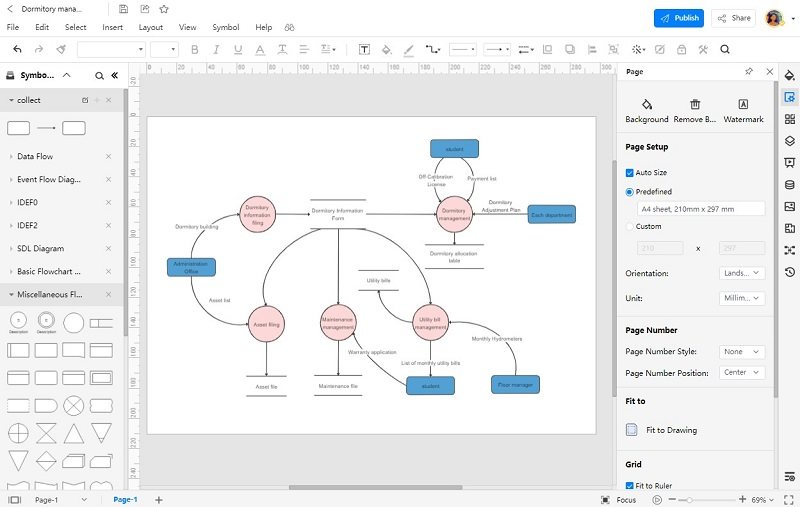
For instance, in the following example, you can see the flow of data in a customer management system. Here, the illustration explores how the orders are received, payment is processed, and goods are shipped for a particular store.
2. Common Flow Diagram Symbols and Meanings
Now when you know the importance of data flow diagrams, let’s get to know how to create them. One of the good things about DFDs is that they are extremely easy to make and only have four major components.
When it comes to data flow diagram symbols and meaning, there can be different models such as Yourdon & Marco, Gane & Sarson, SSADM, and so on. Out of them, the Yourdon and Marco model is the most popular approach that is universally followed to create data flow diagrams.
| Symbol | Name | Description |

|
Entity | It is represented by a rectangle and simply depicts a source or termination of the diagram by mapping real-world entities. |
|
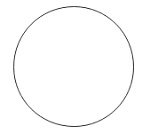
Process | It is represented by a circle and depicts how the data is handled and processed in the system. |

|
Data Store | It is represented by two parallel lines and depicts a location where data is stored in the system. |
|
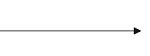
Data Flow | It is represented by directional lines and depicts the flow of data from one location to another. |
2.1 Entity
Also known as eternal entities, they are often placed at the source or the terminal ends of the diagram. They provide a real-world representation of things in the diagram and are responsible for sending or receiving data. For instance, in the above data flow diagram, customers and warehouses are entities.
2.2 Process
It is one of the most important data flow diagram symbols that depict the processing of data at any stage. A process would have incoming data, a management operation, and an output. It usually provides logical management or change in data. In the diagram, you can see that payment collection or order placement are some of the vital processes.
2.3 Data Store
It simply depicts any location where data is stored in the system. It can be a document or an entire database that is used as a repository to store and handle data. In DFDs, Data Stores can have an input to collect data and an optional output to provide the stored data to any other entity or process. In our diagram, customers, invoices, and orders are some of its data storage units.
2.4 Data Flow
Lastly, any data flow diagram would be incomplete without representing the flow of data from one entity/process to another. As you can see in the diagram, we use directional lines to depict how the data is moving from one place to another. At times, we also add captions on data flow arrows to make others understand these data flow diagram symbols and their meanings.
3. Expert Tips for Using Data Flow Diagram Symbols
After getting to know about these data flow diagram symbols and rules, you can also come up with some informative illustrations. To get better results with your DFDs, just follow these suggestions.
3.1 Use a Professional Data Flow Diagram Tool
If you want to maximize your efficiency and come up with visually appealing diagrams, then consider using EdrawMax Online. Developed by Wondershare, it is a smart diagramming tool that offers thousands of graphics and visual entities. Using them, you can come up with 280+ different types of diagrams, including data flow diagrams.
You can find hundreds of templates in EdrawMax so that you can readily pick any template and customize it as per your requirements. Besides that, you can also use the wide range of data flow diagrams in the application to come up with stunning DFDs via simple drag and drop actions.
3.2 Explore the Existing Data Flow Diagram Symbols in EdrawMax
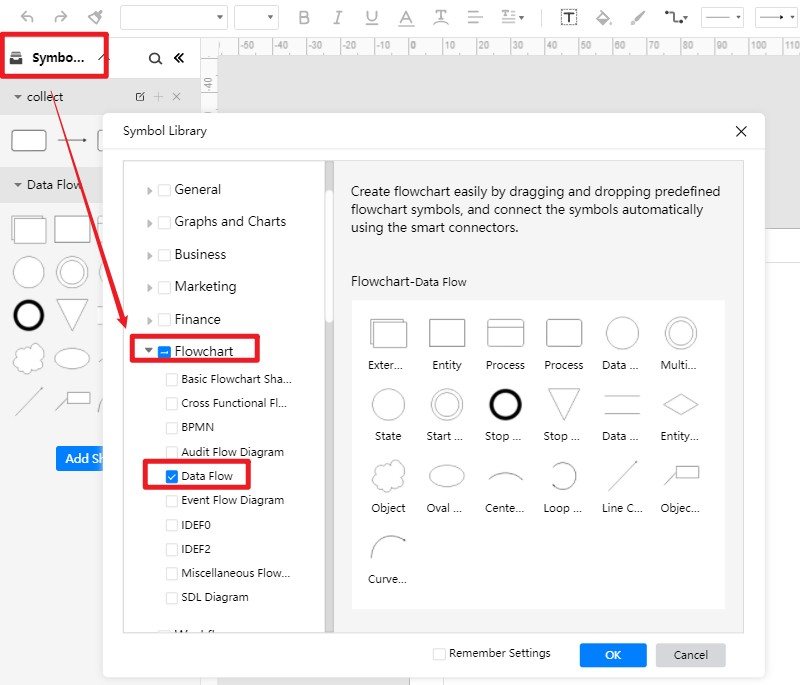
As I have listed above, you can readily import any existing template or work on a new canvas in EdrawMax. To use the available data flow diagram symbols, you can just go to the library feature from the sidebar. Now, click on Symbol Library > Flowchart > Data Flow to include all the major data flow diagram symbols in your projects.
3.3 Import Symbols and Icons from any Other Source
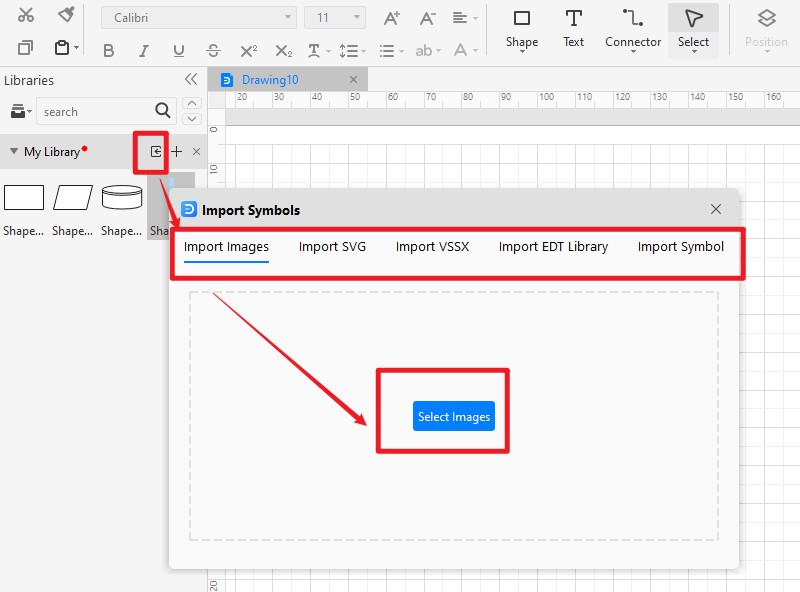
If you want, you can also import all kinds of symbols, icons, or other diagramming entities from any other source to EdrawMax. Just go to the library feature from the sidebar and click on the Import icon. This will open a new pop-up window that would let you import images, SVG symbols, EDT libraries, VSSX files, and so on to your EdrawMax project.
Here is a video to learn how to customize symbols and libraries in EdrawMax
4. More Questions About Data Flow Diagram Symbols
To further understand the data flow diagram symbols and meaning, you can also go through these important questions.
1. What are the symbols used in data flow diagrams?
Gane and Sarson came up with a new notion for data flow diagrams compared to the existing Yourdon & Marco notations. In this, processes are represented by rounded rectangles instead of circles while the other symbols are the same.
3. What is the use of Data Flow Diagrams?
Data flow diagrams are extensively used in software engineering and analysis to understand the working of a system and represent the flow of data in it. Ideally, it helps us devise how data is moved from one entity/process to another in a system.
5. Conclusion
I hope that after reading this guide, you would be able to know more about data flow diagram symbols and meaning. Since DFDs only have four major symbols, you can easily understand their meaning and implement them to come up with all kinds of data flow diagrams. Though, if you are looking for a smart and user-friendly application to create data flow diagrams, then EdrawMax Online would be an ideal pick. You can get start with data flow diagrams examples with EdrawMax. It is a DIY diagramming tool that offers a wide range of libraries and templates to create 280+ different diagram types in one place.
Create and share 280+ diagrams with EdrawMax Online