Free Editable Laboratory Drawing Examples
Most of the scientific experiments are results of constant observation. The researcher monitors the condition of the experiments and records the data. The process of the experiment interestingly plays a significant role in depicting the result. Therefore, the researcher makes laboratory drawings that help them know about the instruments, their positions, and the sequence of things during the procedure.
1. What Is the Laboratory Drawing
Laboratory drawings can be of two different types. One of them is making a diagram of what the researcher can see when they put the sample under the microscope. When a researcher makes a diagram of the procedure and laboratory setup, they have prepared for an experiment known as laboratory diagrams. They allow the researcher to know the instrumental setup and various observations required to derive their result.
2. The Laboratory Drawing Examples
The laboratory drawings can be of several patterns based on the types of experiments the researchers use for their research. Here are a few examples of the researchers' laboratory drawings to follow who can use them as references while working on their experiments.
 |
 |
 |
| Laboratory Drawing | Chemistry Diagram | Chemistry Experiment |
 |
 |
 |
| Desalination Experiment | Lab Diagram | Conservation of Mass Experiment |
 |
 |
 |
| Acid Reactions With Metals | Effect of Temperature on Rate of Reaction | Chemistry Lab Equipment |
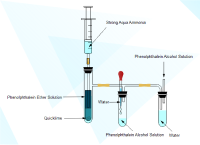
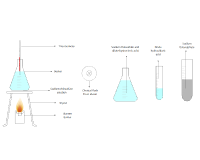
Example 1: Laboratory Drawing
A chemical reaction can be a sudden reaction or may show a delayed change, and it depends on the nature of the experiments. Sometimes, the researcher may fail to observe all the changes occurring in the setup because the reaction can finish in a fraction of seconds. The reactions may produce heat which the researcher needs to record. Here is an example of a laboratory diagram that shows the laboratory setup of the ammonia and water reaction.
 Source:EdrawMax Online
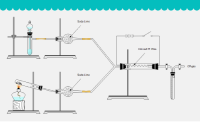
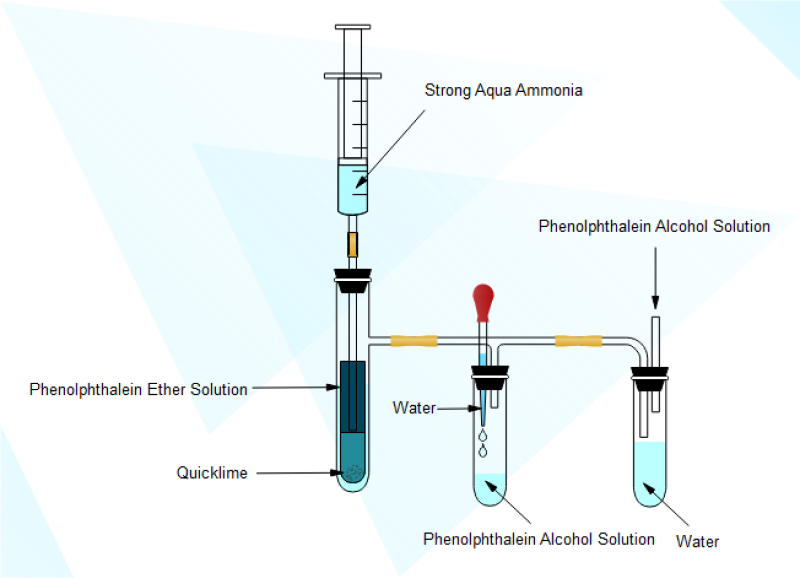
Example 2: Chemistry Diagram
The researchers who work in chemical laboratories need to keep an eye on the whole process. A simple change in the setup can give a different result. Sometimes they can harm the process even. For that reason, using a laboratory diagram is best. The teachers who teach the students about scientific experiments can use laboratory diagrams to explain the whole process. Here is an example of a laboratory diagram that the researcher can use as a guide, and they can also modify it as per their requirements.
 Source:EdrawMax Online
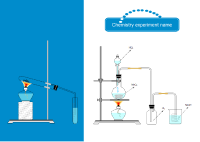
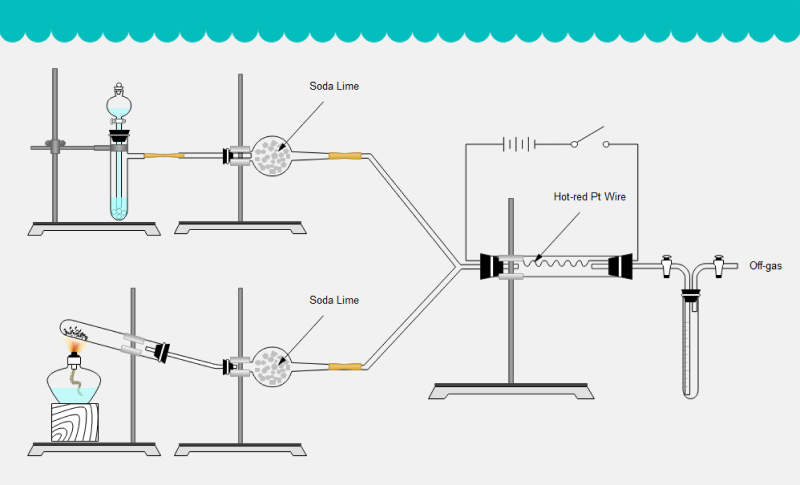
Example 3: Chemistry Experiment
The researchers who work in chemical laboratories need to keep an eye on the whole process. A simple change in the setup can give a different result. Sometimes they can harm the process even. For that reason, using a laboratory diagram is best. The teachers who teach the students about scientific experiments can use laboratory diagrams to explain the whole process. Here is an example of a laboratory diagram that the researcher can use as a guide, and they can also modify it as per their requirements.
 Source:EdrawMax Online
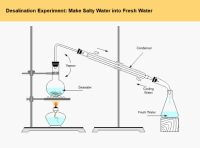
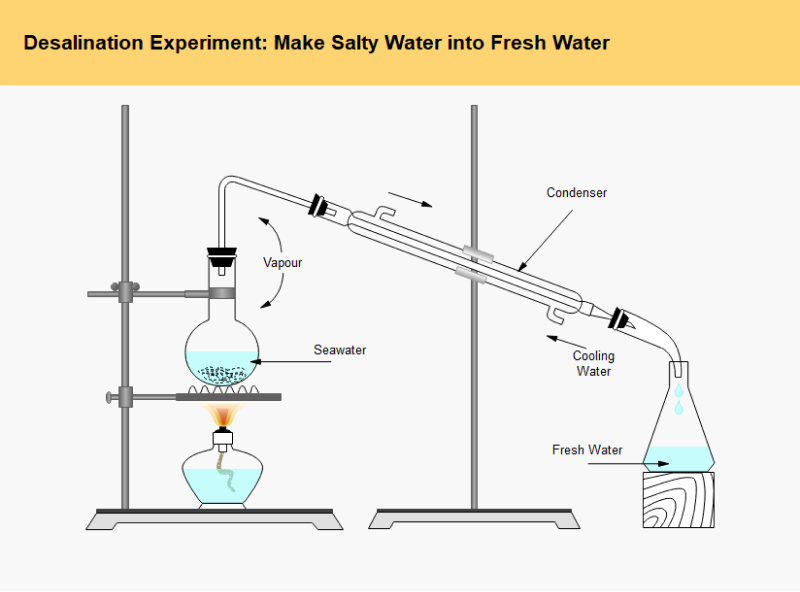
Example 4: Desalination Experiment
An experiment can be simple and easy, but it may follow some steps, and the setup can be critical. When research or student is working on any experiment, they must ensure that the instrument setup is on point. Hence, when a student is learning about an experiment, it is better to follow a laboratory diagram than merely reading the process. Here is an example that shows the separation of salt and water from saline water, and a student can quickly learn it by checking the diagram.
 Source:EdrawMax Online
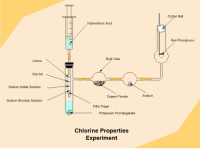
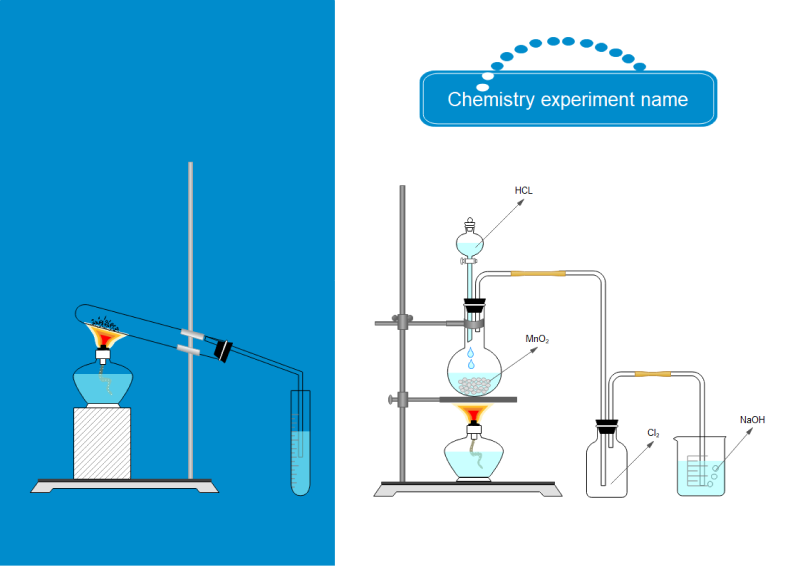
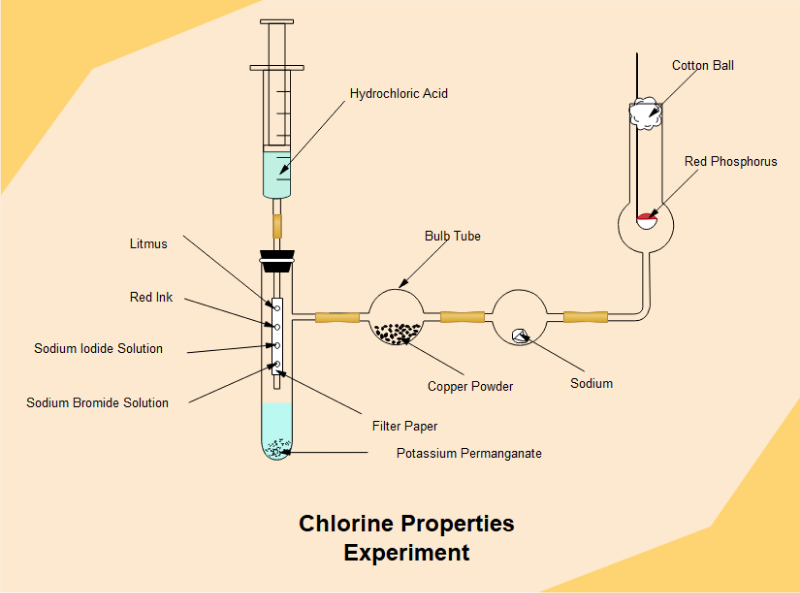
Example 5: Lab Diagram
To know the properties of an element, a researcher can conduct a series of experiments. When the element takes part in several experiments, and the researcher sees the results, they can clearly understand its various properties in the given example of the laboratory diagram to show chlorine properties experiments and its instrumental setup.
 Source:EdrawMax Online
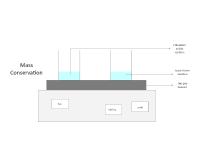
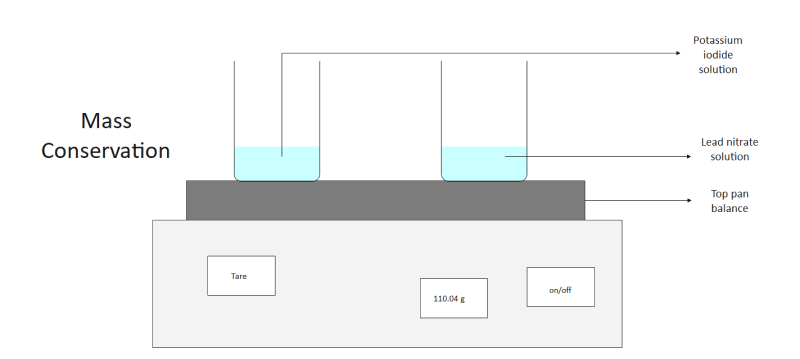
Example 6: Conservation of Mass Experiment
For any chemical reaction, the elements that participate in a reaction are equal in mass to the experiment's products. This property is called the mass conservation of an experiment. The researchers can do this experiment with a simple instrumental setup. Here is a laboratory diagram that shows the mass conservation property that occurs during an experiment.
 Source:EdrawMax Online
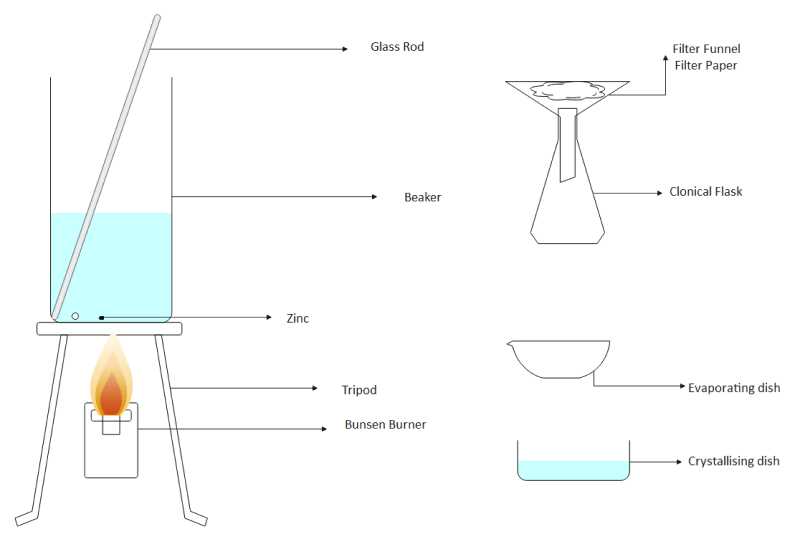
Example 7: Acid Reactions With Metals
Many metals react with the acids to form salt and release hydrogen gas. A series of experiments with metals and acids can confirm this property. While experimenting, the researcher must follow a particular procedure. In the given example of the laboratory diagram, the researchers can see zinc's reaction with sulphuric acid. They can modify it while working on a similar sort of experiment.
 Source:EdrawMax Online
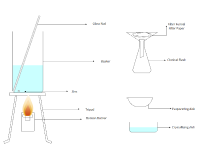
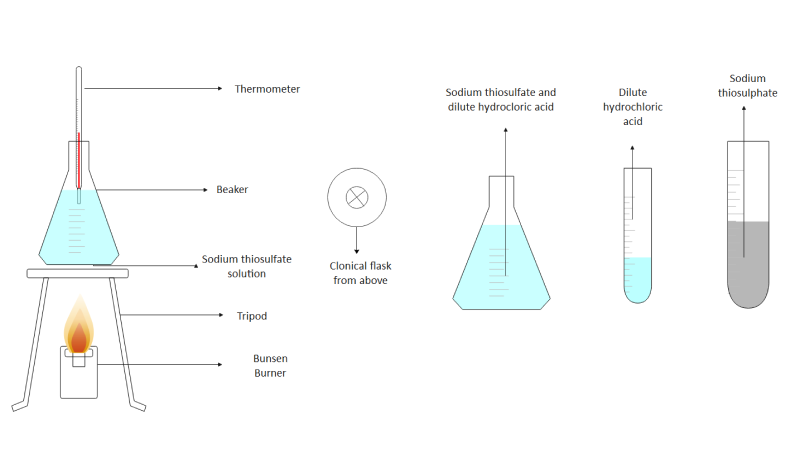
Example 8: Effect of Temperature on Rate of Reaction
An experiment can be exothermic or endothermic. For a reaction to occur, there is the requirement of a particular temperature. If the favorable temperature changes during the experiment because of the heat generation or absorption, that can hinder the experiment's process. Here is a laboratory diagram that shows the process of the experiment between sodium thiosulphate and hydrochloric acid.
 Source:EdrawMax Online
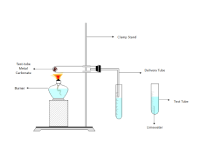
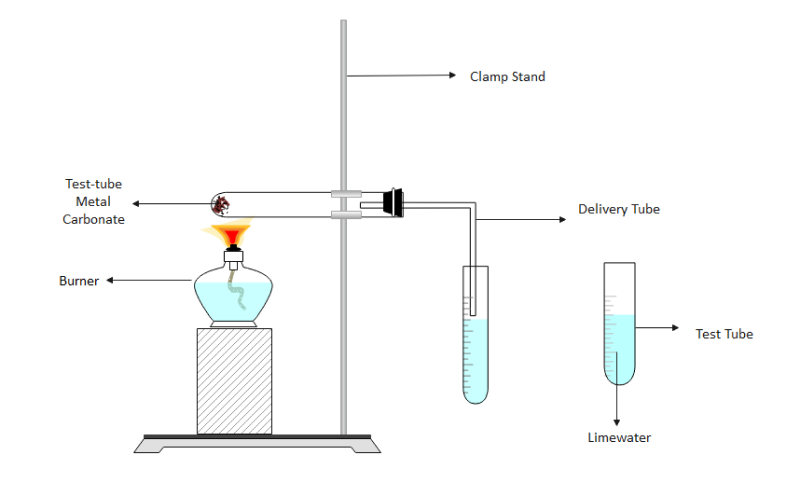
Example 9: Chemistry Lab Equipment
The rate of reactivity of various elements can vary from one to another. Even though the elements are similar, their reactivity can be different from each other. For example, when metal carbonates that get heated decompose. The researcher can subject various metal carbonates to similar experiments to find out their reactivity. Here is a lab drawing that shows the reactivity of metal carbonates.
 Source:EdrawMax Online
3. Online Laboratory Drawing Maker
It may seem not very easy to depict the whole experiment produced graphically, but it becomes easy with an online tool. The users can use tools like EdrawMax, which comes with several templates and symbols that the researchers need to draw the pictures. The tool is user-friendly, and hence it is perfect for inexperienced users. The tool also has a resource center for the users to seek when they have any issues with their work.
EdrawMax Online not just an online laboratory drawing designer. Use EdrawMax Online to create your Laboratory Drawings without efforts, just grab a template or choose one from EdrawMax Template Gallery and keep customization as your preference.
Why Choose EdrawMax Online
- Create over 280 diagram types
- Supports team collaboration
- Personal cloud & data protection
- Print, share and download
- Powerful template community
4. Key Takeaways
The researchers can use the laboratory diagrams to note the setup and other details of an experiment. The teachers and students can also use lab drawings to learn the experiments quickly. For that, they can use an online tool like EdrawMax that can give them a user-friendly experience. They can also use the templates and modify them as per their choice.
In conclusion, EdrawMax Online is a quick-start diagramming tool, which is easier to make laboratory drawings and any other visuals. Also, it contains substantial built-in templates that you can use for free, or share your design with others in our Template Community.


