Free Editable Fault Tree Analysis Diagram Examples
Back in 1962, H Waston and A Mearns developed the fault tree analysis in Bell Laboratories. Several tools are there that help identify potential failures, their mechanism, and causes. The fault tree diagrams are tools like these. Fault Tree analysis is a deductive analysis that depicts a visual path of failure. Potential failures, if detected early, can help mitigate the risk. It saves consumers from an untoward experience.
1. What Is a Fault Tree Analysis Diagram
A fault tree helps to depict a failure chain or path. The fault tree analysisfollows the Boolean logic concept that creates true or false sentences. If one links the statements in a chain, they develop a logic diagram of failures. The events arrangements are there in series or parallel relationships. People use logic symbols to mark dependencies among events.
If one can mitigate the risk before the program launch, it helps him in numerous ways. For example,
- If one analyses the hazard beforehand, he builds a safety corner for himself.
- He can find new content with innovative designs.
- With minor modifications, one may include changes to the past failure.
- One can investigate the regularity or safety concerns.
- The pictorial representation is always better than a written inductive analysis.
Fault tree diagrams are not hard to make. By following some basic steps, one can easily create them.
- At first, one needs to identify the hazard.
- Next, he must obtain some understanding of the system that he is analyzing.
- Now, it is time to create the fault tree.
- He can identify the cut sets.
- Lastly, he must mitigate the risk.
2. The Fault Tree Analysis Diagram Examples
People use fault tree analysis in automobile, aerospace, nuclear, chemical, and software industries. They help in the risk assessment processes. One can use it to solve complex systems and logically identify problems. The fault tree highlights the critical components. By analyzing methods, one can prioritize the action items to solve a problem. It is a must use for qualitative and quantitative analysis.
|
|
|
| Fault Tree Analysis Diagram | Fault Tree Analysis | Fault Tree Analysis Template |
|

|
|
| Fault Tree Analysis Example | Fault Tree Diagram | Fault Tree Analysis Sample |
|
|
|
| Component Flow Fault Tree | Gas Pipes Fault Tree Analysis | Fault Tree Diagram Template |
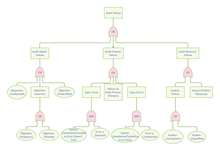
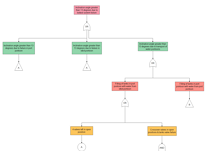
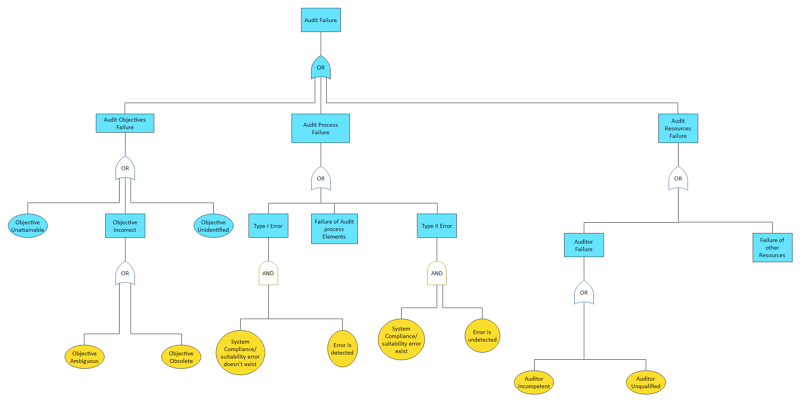
Example 1: Fault Tree Analysis Diagram
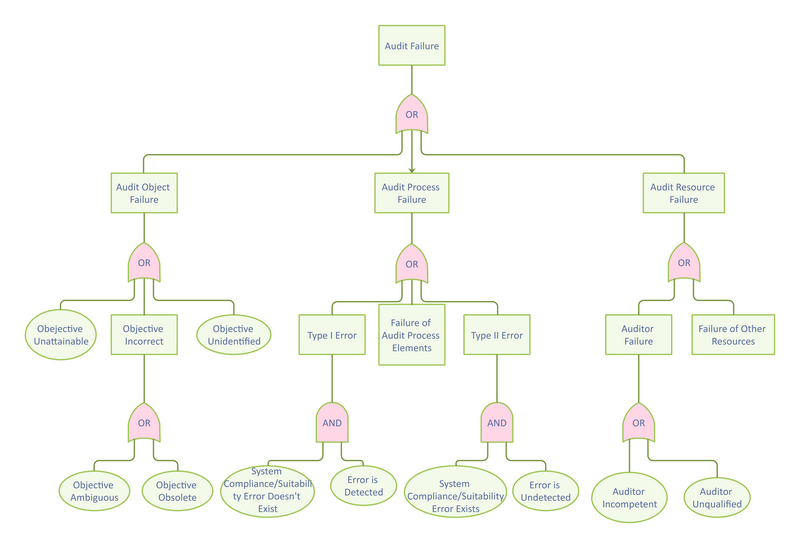
The given fault tree is an audit-failure fault tree diagram, which helps analyze why an audit fails to perform. The example depicts how the result of the audit failure can lead to system failure. Any undesirable event can happen in an organization at any time. It is helpful to analyze the origin with a fault tree analysis.
One can take help from an online fault tree diagram maker like EdrawMax to make his own.
 Source:EdrawMax Online
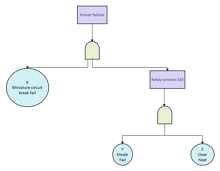
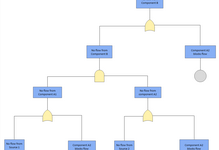
Example 2: Fault Tree Analysis
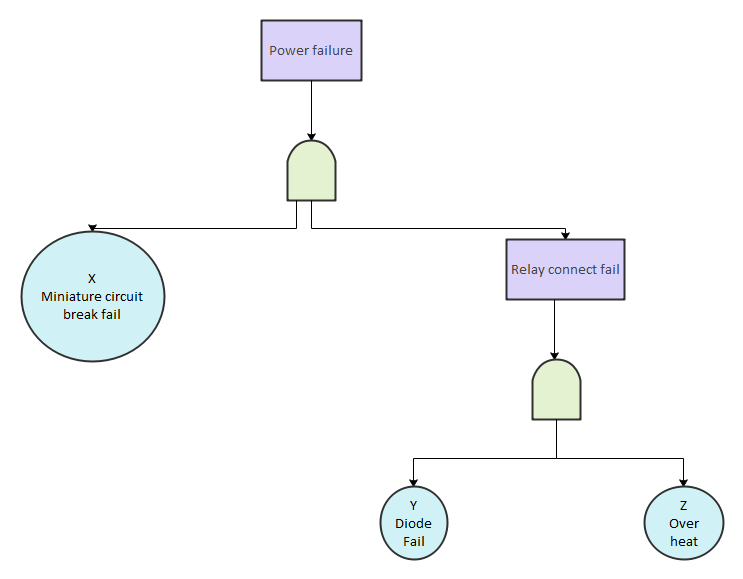
The fault tree shows the power failure incident despite the safety system rightly placed.
The safety team uses FTA and analyses the existing system to identify the potential causes of an accident. EdrawMax has diagrams like this.
 Source:EdrawMax Online
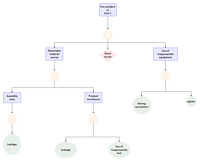
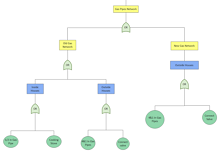
Example 3: Fault Tree Analysis Template
The third fault tree depicts the fire accident in unit 1. One can identify all the inappropriate equipment in the system that may lead to a fire accident using applications like EdrawMax, an online fault-tree analysis diagram maker. The diagram helps to identify the leakage or short circuit areas.
 Source:EdrawMax Online
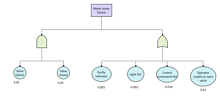
Example 4: Fault Tree Analysis
The fourth fault tree example shows the causes and risk of a water pump failure. Using an online decision tree diagram maker like EdrawMax, it is easy to determine the valve failure, faulty indicator, light fall, control command fail, or the inability to open a valve on the operator’s part.
 Source:EdrawMax Online
Example 5: Fault Tree Diagram
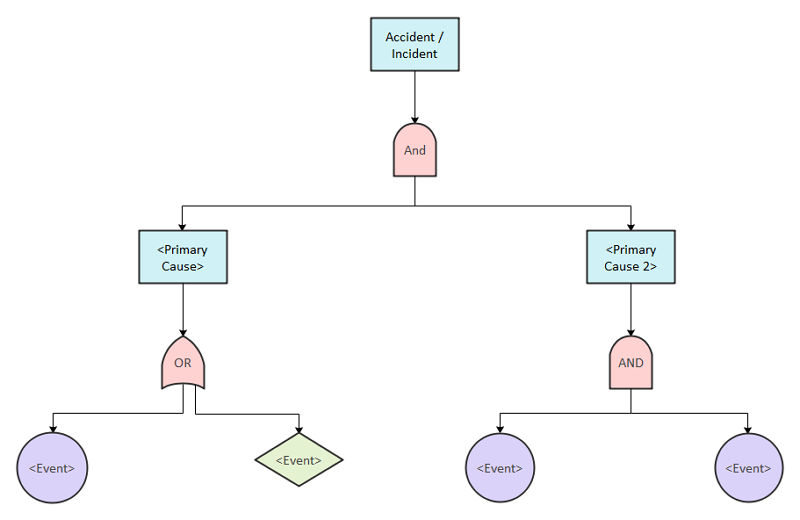
The given fault tree example shows the primary causes of an accident. There are various customizable fault tree analysis templates with tailor-designed features in EdrawMax. They help edit the charts with various text, images, and shapes.
 Source:EdrawMax Online
Example 6: Fault Tree Analysis Sample
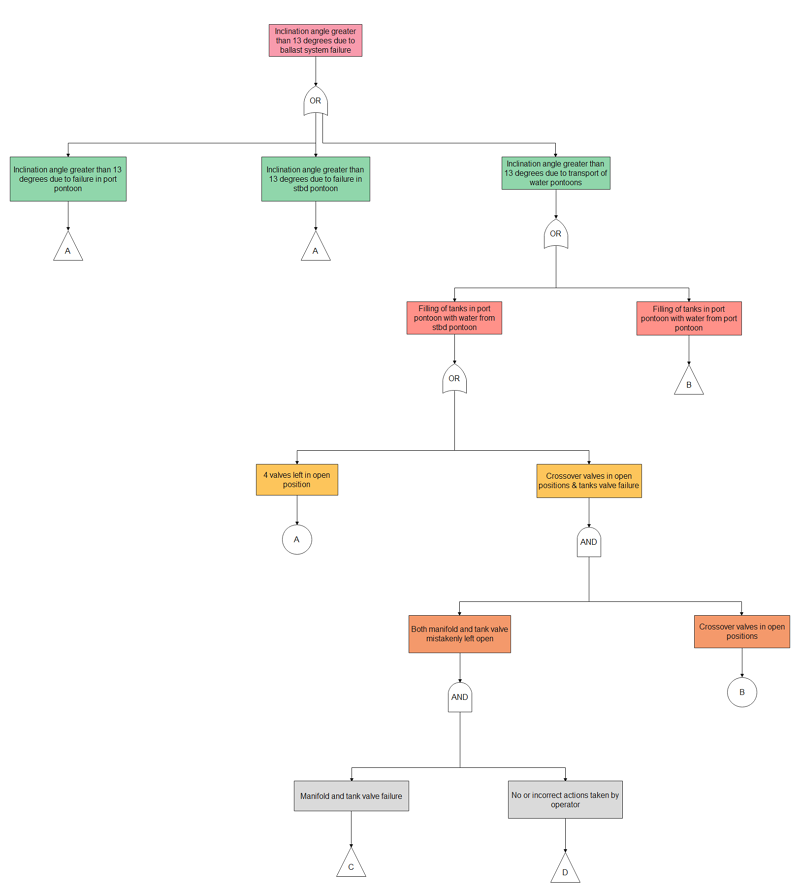
The given fault tree example shows what happens when the inclination angle is greater than 13 degrees; it may lead to ballast/ port pontoon/stbd pontoon system failure. The visual representation uses the symbols of ‘And,’ ‘Or’ gates.
The algorithms of a fault tree help in risk analyses; however, many discrete attributes or Boolean functions make the fault analyzing procedures easy. EdrawMax has the highest level of SSL encryption.
 Source:EdrawMax Online
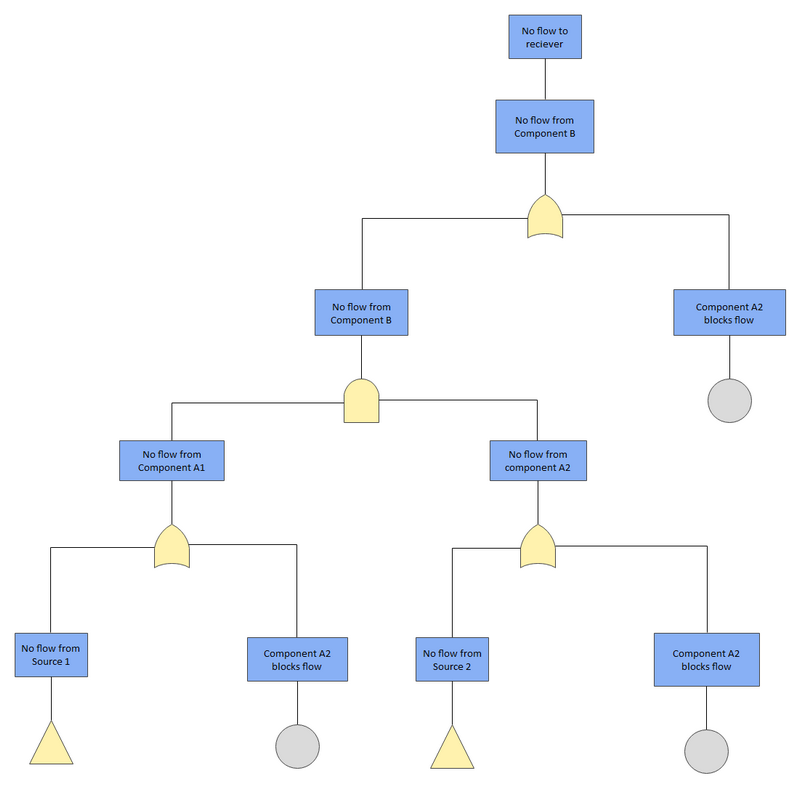
Example 7: Component Flow Fault Tree Analysis
The given fault tree example is a component-flow fault tree analysis. The online fault tree maker EdrawMax tool helps create this type of chart quickly by the intuitive drawing editor. However, one can always change the content with colors and font choices.
 Source:EdrawMax Online
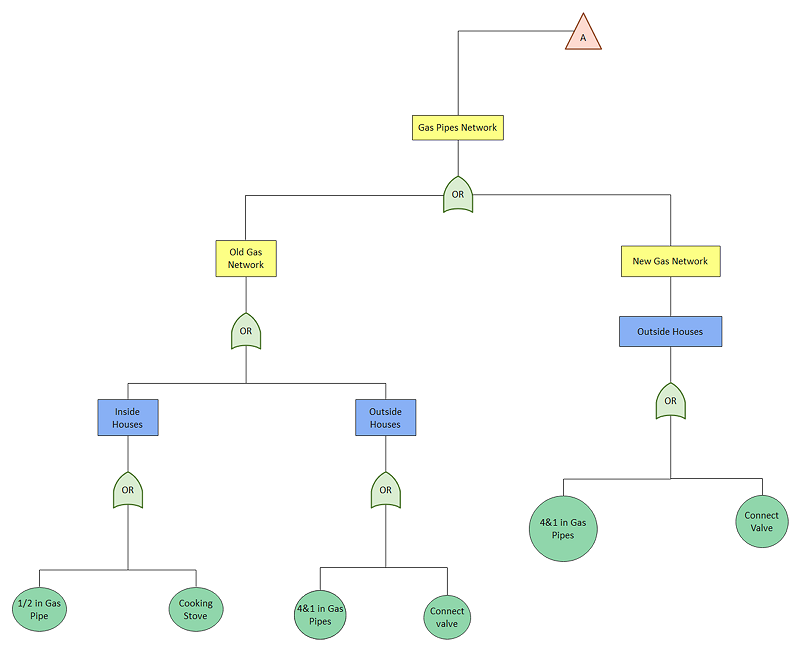
Example 8: Gas Pipes Fault Tree Analysis
This fault tree diagram is useful for gas pipes fault tree analysis. This diagram supports fault tree analysis with various UML, rack diagrams, charts, org charts, flowcharts, ERD, floor plans, and family trees.
EdrawMax’s online portfolio offers a wide range of visualization choices.
 Source:EdrawMax Online
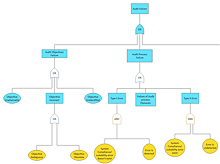
Example 9: Fault Tree Diagram Template
The given fault tree example is an illustration of audit failure in Friday facts fault tree analysis. It shows the necessary relations that trigger the undesired state. This fault tree diagram also helps understand the primary causes and provides the framework for a quantitative and qualitative evaluation of the events.
 Source:EdrawMax Online
3. Online Fault Tree Analysis Diagram Maker
One can use an online diagram maker like EdrawMax Online or smart draw to make a fault tree template . It helps create a visual record that creates logical relations between causes and events. One must use them to prioritize issues and fix them to contribute to a failure.
EdrawMax Online not just an online fault tree analysis maker. Use EdrawMax online to create your circular flow diagrams without efforts, just grab a template or choose one circular flow diagram template from EdrawMax Template Gallery and keep customization as your preference.
Why Choose EdrawMax Online
- Create over 280 diagram types
- Supports team collaboration
- Personal cloud & data protection
- Print, share and download
- Powerful template community
4. Conclusion
The fault tree analysis diagrams create a visual record to pinpoint the weaknesses of a design. They identify the errors and build the foundation for further evaluation and analysis. One can use fault trees not only to design quality tests but to maintain the procedures.
EdrawMax Online is the easiest AWS architecture diagram maker, since it contains substantial AWS symbols and templates. Also, just drag and drop the AWS elements, and your diagram is ready! If you still confused about how to make a fault tree analysis diagram in EdrawMax online, just check this fault tree analysis guide, it will help you to make diagrams without efforts.


