How to Make a Line Graph in PowerPoint
A line graph is a visual illustration of continuously changing data in a series of markers on a line segment. A line graph is also called a line chart and line plot. One popular software to create a line graph is MS PowerPoint. If you want to learn how to make a line graph, then continue reading this article. We will give you a simple how-to tutorial on how to make a line graph in PowerPoint.
How to Make A Line Graph in PowerPoint
Step 1 - Open PowerPoint
Open PowerPoint 2013 or later version on your desktop and select a blank presentation, or if you already have slides prepared, choose the one where you want to create a line graph.
Step 2 - Remove text box and placeholder
Press Ctrl + A to select text boxes and placeholder text on the slide. Now, click Delete to remove them. Then you will get a blank slide.
Step 3 - Insert Chart
Right next to the Home tab is the Insert tab; click on the Chart icon to launch the Insert Chart window.
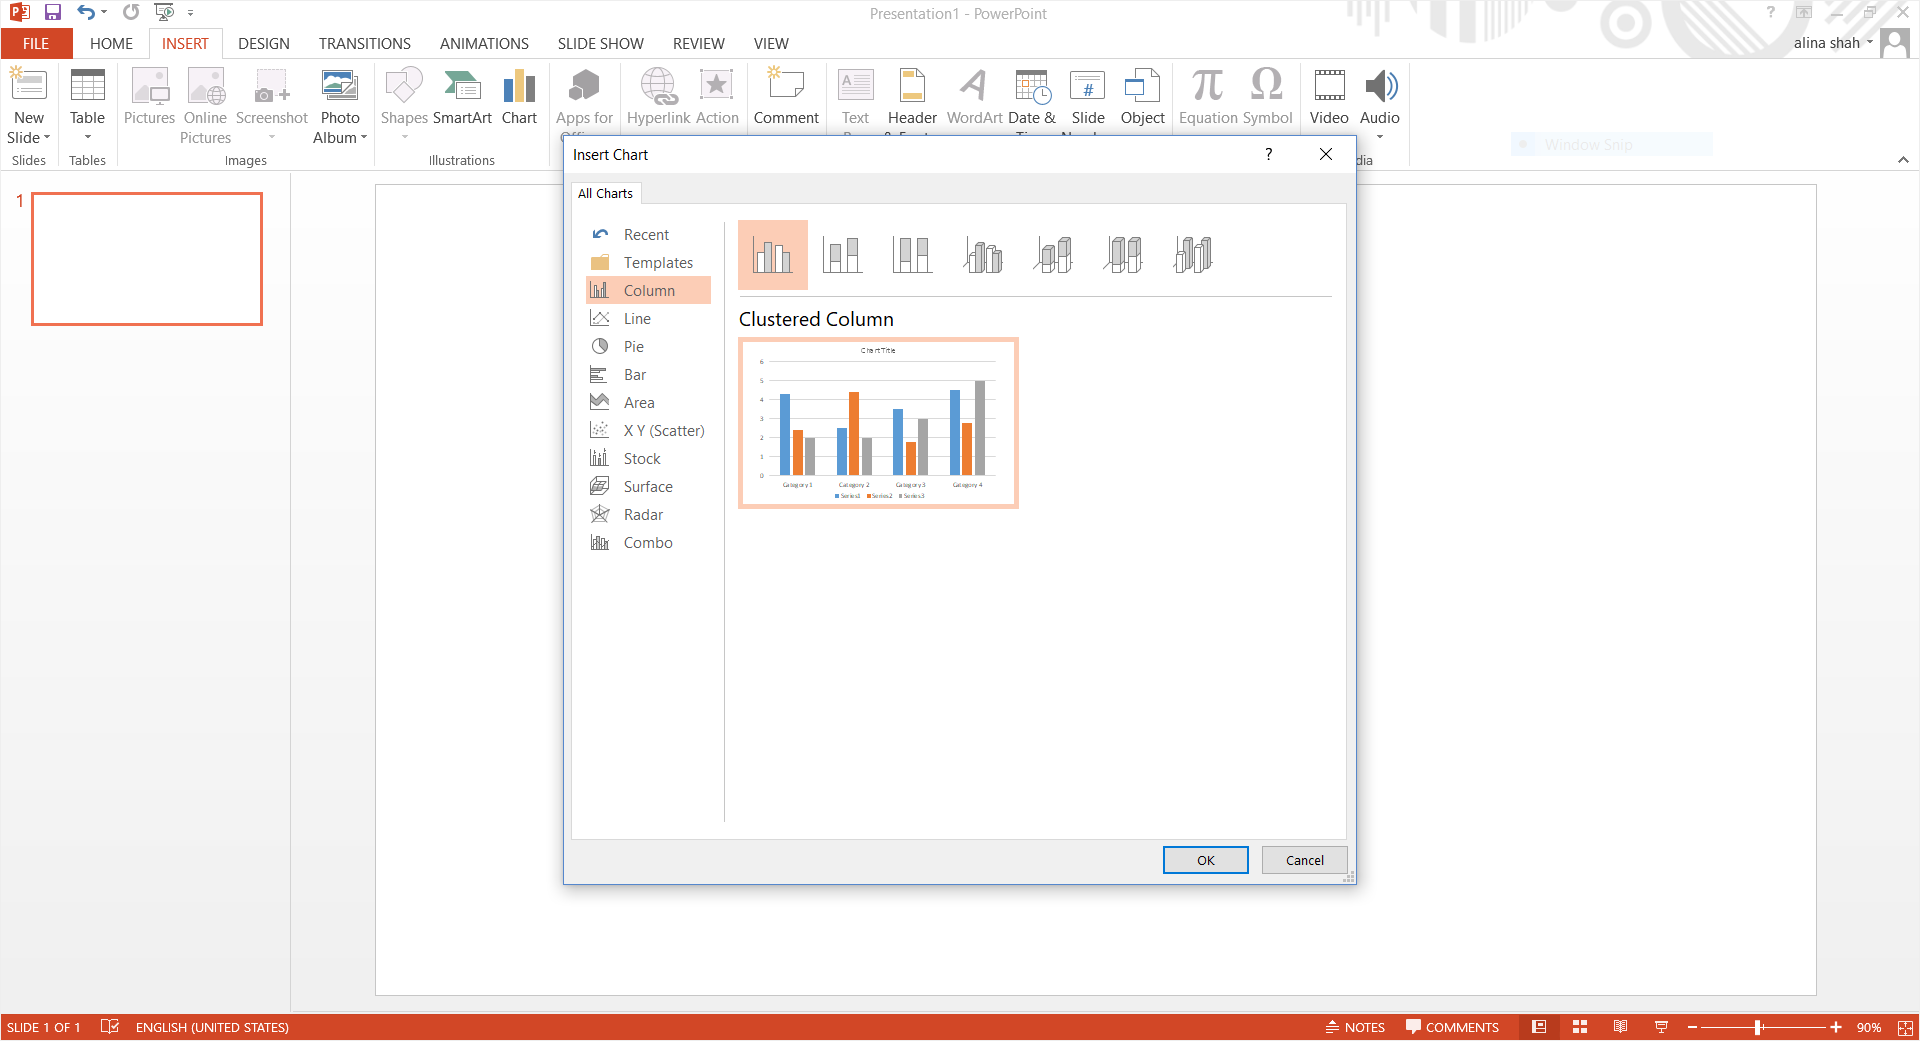
Step 4 - Select Line Graph
You will see different options on the left side of the window. Click on the Line option in the navigation pane. Now choose the line chart you want and press OK to insert it on your slide. A PowerPoint line chart will appear on your slide. The values will go on the vertical axis, and the bases (categories) will go on the horizontal axis.

Step 5 - Edit your chart
Once you have added the values and all the relevant information, you can change the color, font size, and font style according to your preference. Your PowerPoint line chart is complete now.
Step 6 - Save your document
Close the PowerPoint window once you have edited the data. To save the document, click on the File tab in the extreme left corner of the window. Click on the Save option to save your file. A pop-up window will appear. Please select the desired file location, name your document, and click on Save to keep it on your desktop.
How to Make A Line Graph in EdrawMax
EdrawMax is a suitable alternative to PowerPoint. Use EdrawMax to create a line graph and other technical diagrams with the help of different useful tools. Display drawing pages in the full-screen mode, like showing a presentation in EdrawMax Online. You can also learn how to make a line graph using this software by following this PowerPoint line chart tutorial.
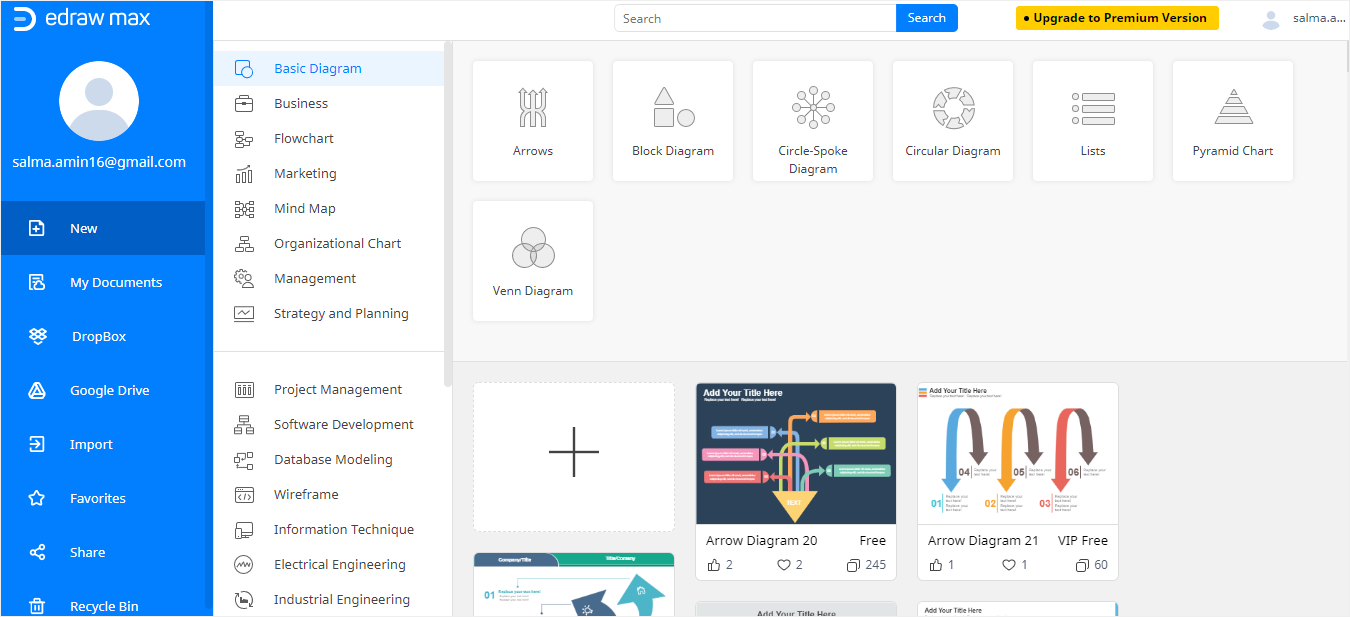
Step 1: Open EdrawMax Online
Open EdrawMax Online at https://www.edrawmax.com/online/ and then sign in to your account, You’ll get the screen below after signing in.
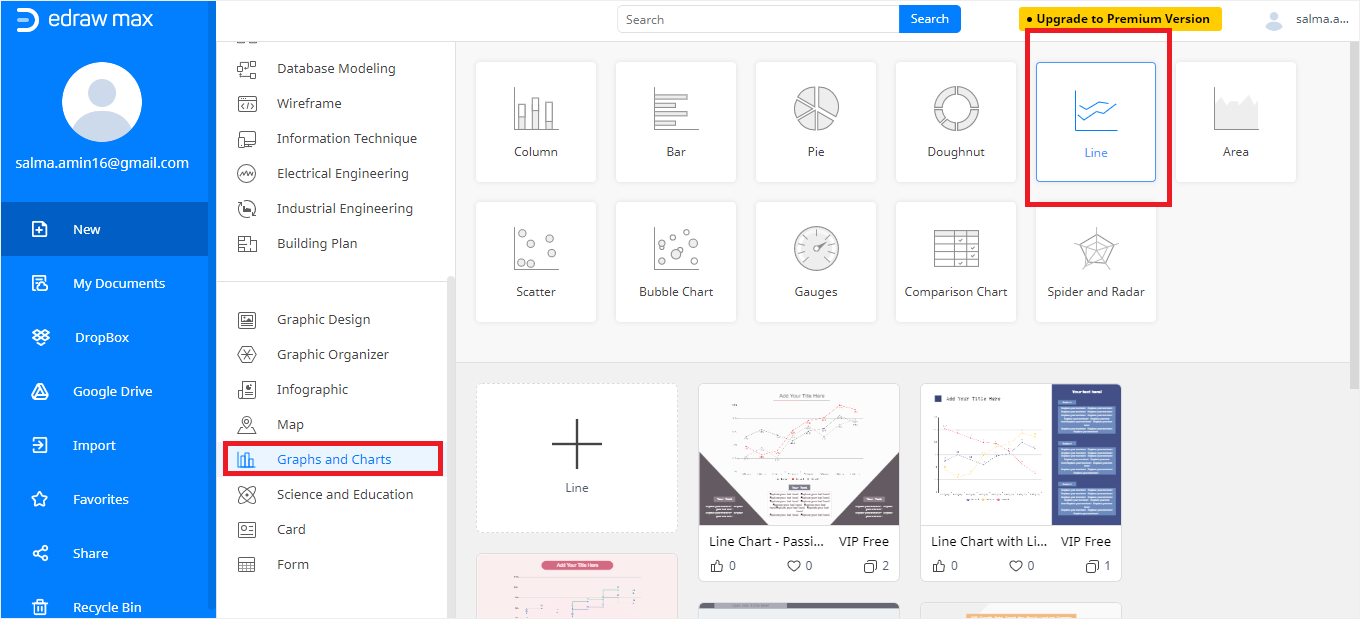
Step 2: Find line graph
Head over to the New tab and then click on the Graphs and Charts section. Next, click Line to select a line graph. The available templates will then be shown.
Step 3: Open a template
Now select a line chart template of your choice. A new window will pop up with your required line chart.
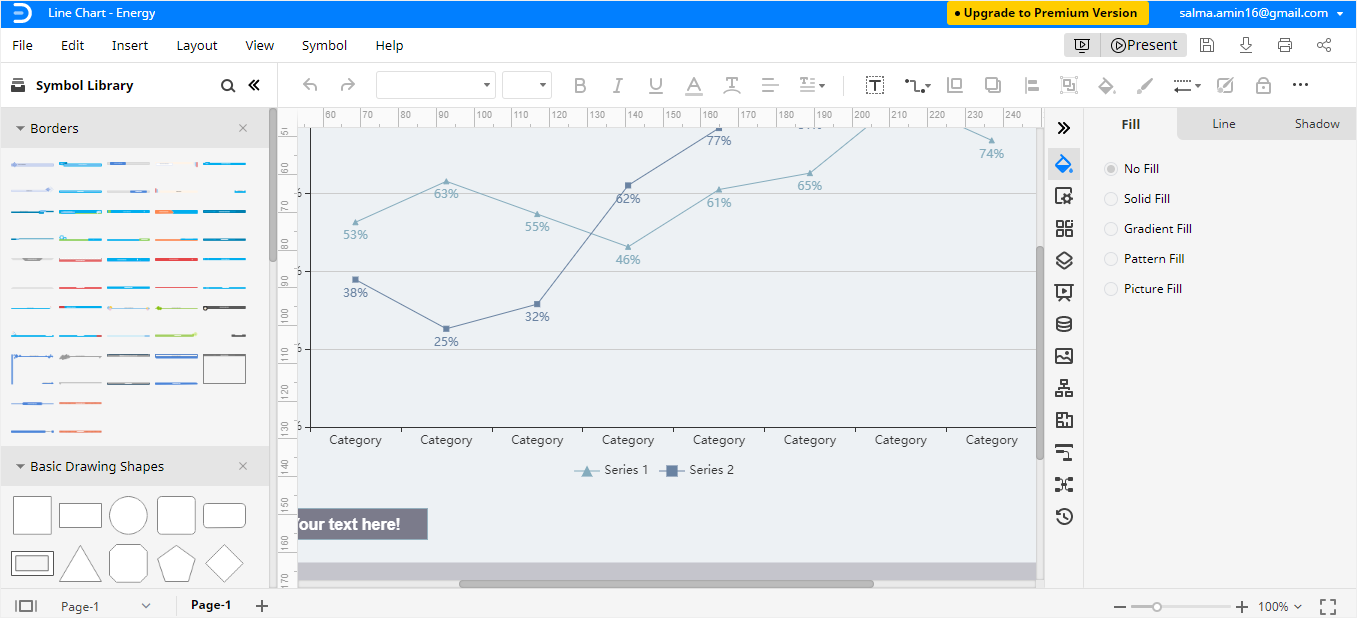
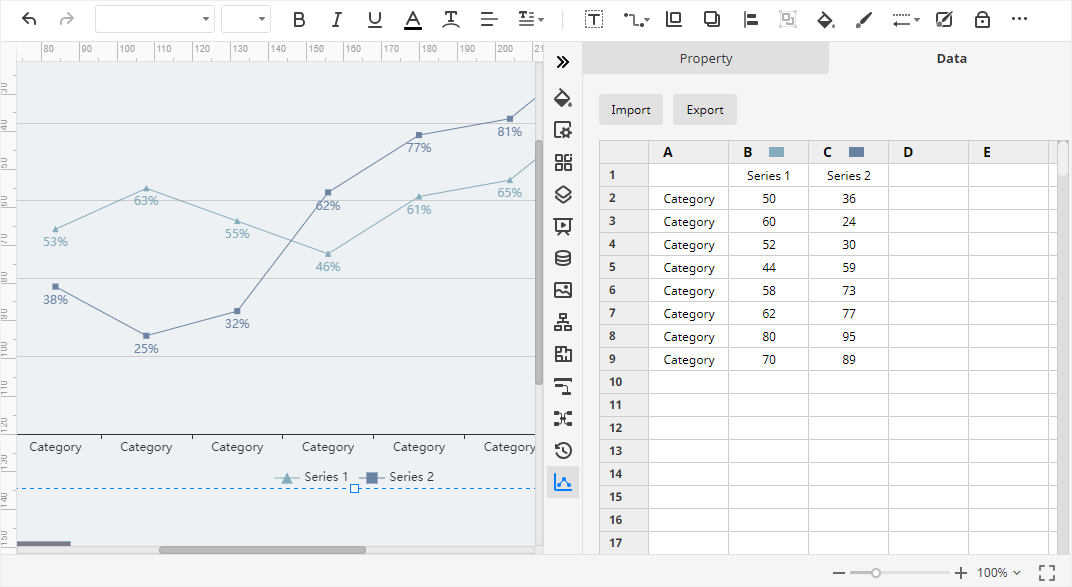
Step 4: Edit your line graph with the data you want
Add data to your chart. You can also import Excel files directly, and data can be automatically extracted from them.
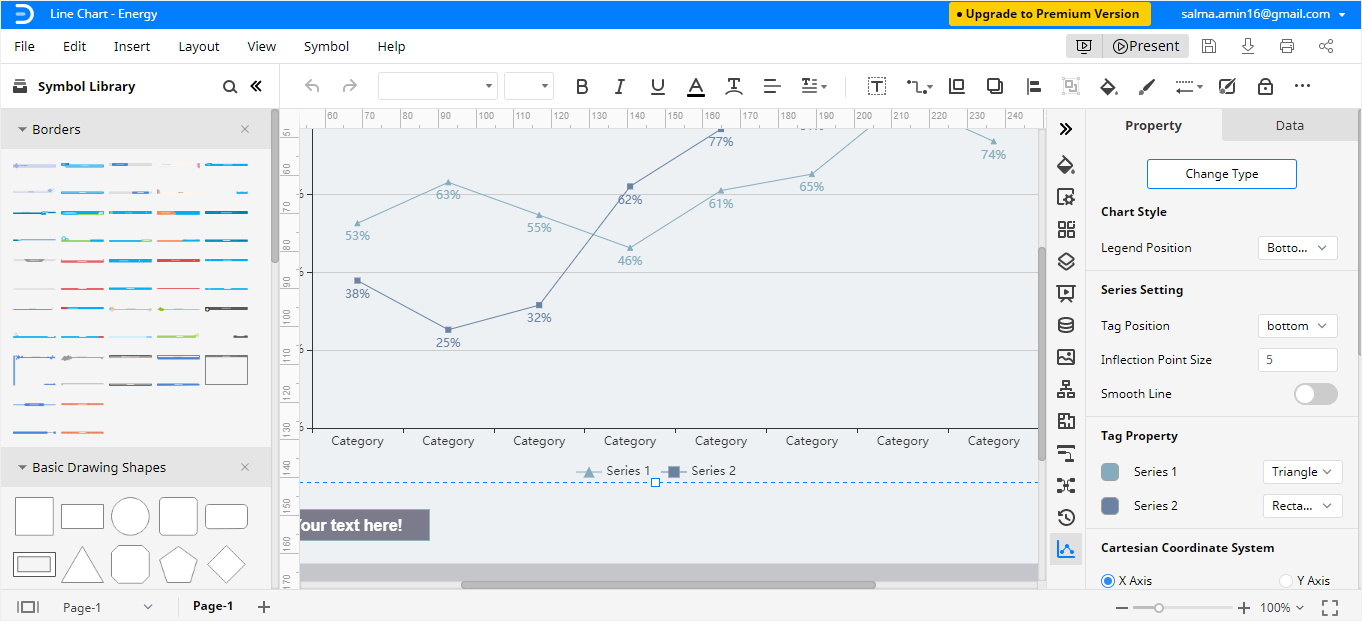
Step 5: Customize your line graph
Edit your line graph and customize it according to your preference. There are numerous editing options available to ensure your data is presented in the exact way you want!
How to Export An Edraw Chart as A PowerPoint File
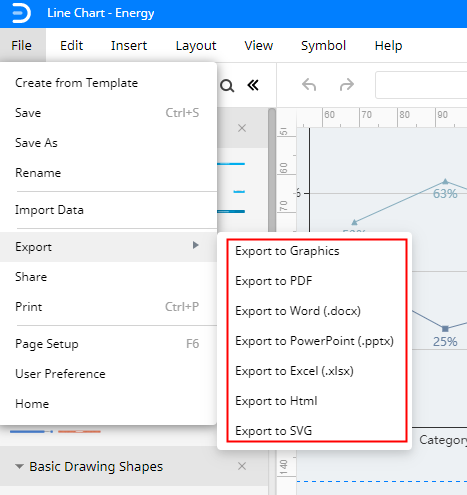
Being a versatile graphics tool, EdrawMax allows users to export Edraw documents as PowerPoint files and save the documents in Google Drive and Dropbox. Users can also edit all the exported MS office files from EdrawMax Online in the corresponding programs.
Hence, when you create a line graph in Edraw, you can save it as a PowerPoint file. Click on the File option in the left corner of the Edraw desktop window and select the Export option. Next, select the Export to PowerPoint option to save your chart as a PowerPoint file.
Our tutorial on how to make a line graph in PowerPoint and Edraw concludes here. Follow this guide step-by-step to master the process of creating a PowerPoint line graph. Now, prepare and design a line chart on EdrawMax like a pro and deliver an impressive presentation.
EdrawMax Online’s basic features can also be used for free!


