What is A T Chart with Examples
Create a T Chart on Edraw.AI Online Free Free Download Free Download Free Download Free DownloadAlmost every day, we come across situations in which we compare things, focus on pros and cons, or just distinguish facts from opinions. Well, this is exactly where a T Chart comes into the picture. It is one of the most popular graphic organizers that help us compare two distinctive things on the basis of different parameters. One of the best things about a T Chart graphic organizer is its vast and diverse use. In this guide, I will teach you what is a T Chart and would also make you familiar with some T Chart examples as well.
What is a T Chart?
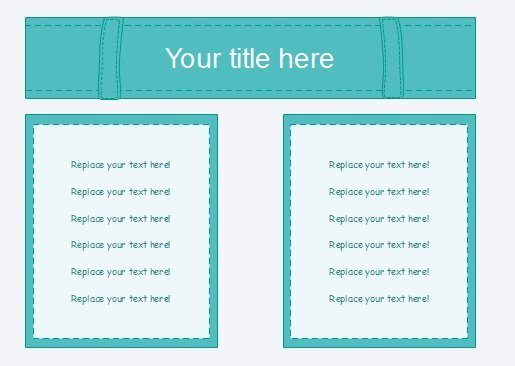
A T Chart is one of the simplest graphic tools that mainly distinguish a subject into two different sets. Although in some cases, we can compare more than two parameters in a single chart as well. This forms a T-like shape with a significant heading at the top and two different sections on each side.
For instance, you can see from this template how a basic T chart graphic organizer looks like. It has a headline that lists two points, followed by what sets them apart. Since a T Chart is based on a tabular format, it is often listed as a simplified form of a 2D column diagram as well.
How Can a T Chart Help You?
Now when you know what is a T Chart, let’s take a step up and learn how these graphic organizers can help you. Ideally, a T Chart can be used in these different ways:
- Mostly, it is used to compare a topic by providing two different options.
- You can showcase a before/after or cause/effect scenario using it.
- It can help you in drawing contrasts and comparisons easily.
- You can also use it to organize your data into two or more groups.
Due to its simplicity, a T Chart is often used for educational purposes as it is easier for us to grab the presented information. Some of the common applications of a T Chart graphic organizer can be as follows:
- Pros and cons
- Before and after
- Causes and effects
- Then and now
- Advantages and disadvantages
- Problems and solutions
- Facts vs opinions
- Strengths and weaknesses
- True or false
Limitations of a T Chart
Although T charts are extremely easy to make and can be used in several ways, they can suffer from a few pitfalls at times. For instance, you can encounter the following limitations while working with a T chart.
- T charts can be restricted as most of the times only two topics can be compared.
- Too often, they fail to depict a more complex relationship between multiple variables.
- They are less of a graphical tool and are more focused on just grouping or comparing things.
- We can’t build up or devise a lot of information or relationships using a T Chart.
- While they are good is depicting real-world instances, they can often fail is representing hypothetical situations or mathematical formulae.
Creative T Chart Examples
As you can see, it is pretty easy to understand what is a T chart and its applications. To further help you with the concept of T Chart graphic organizers, I have listed the following T Chart examples.
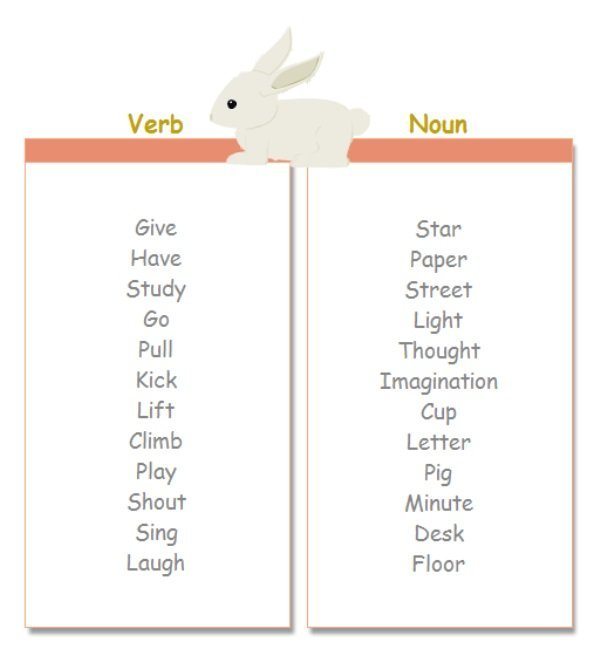
Since T charts are extensively used in education and teaching others, we can learn how to do it from this example. In this T Chart example, we have distinguished between verb and noun. In one section, we have listed commonly used verb phrases while the second section includes common noun phrases. You can use this T Chart graphic organizer to teach others the difference between verb and noun too.
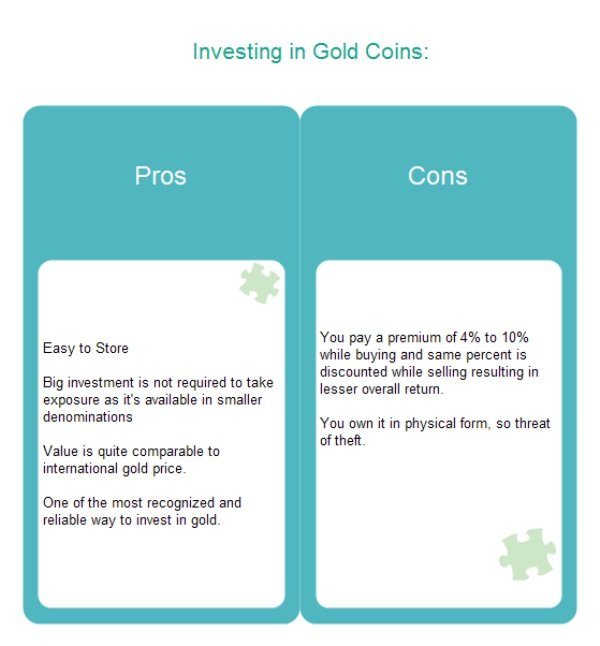
Investing in gold is pretty controversial as it can have some advantages and limitations. To depict the same, we have taken the assistance of this T chart example. For instance, some pros are ease of investment, reliability, etc. On the end other, the threat of theft or extra surcharge can be some disadvantages.
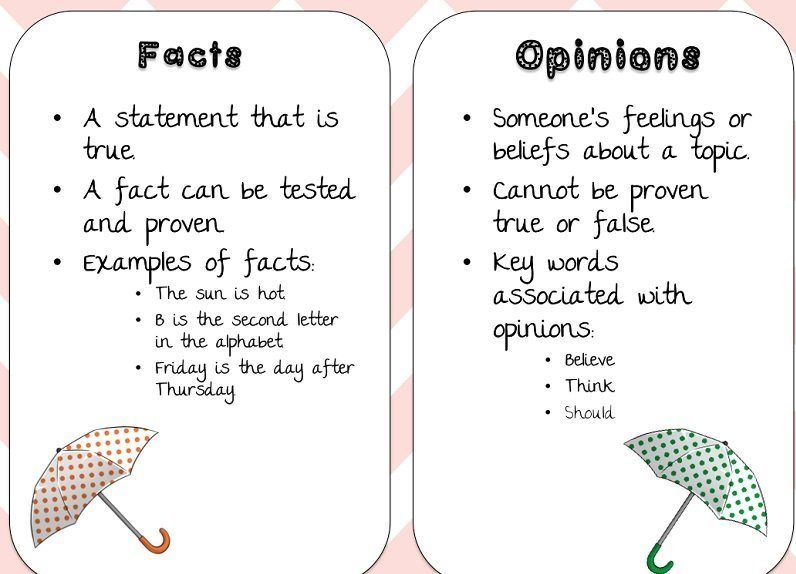
This is one of the most commonly used T Chart examples that differentiate facts and opinions. As you can see, a fact is a proven statement while an opinion can be a popular belief or an assumption.
How to Create a T Chart with EdrawMax Online?
Since T chart graphic organizers are pretty easy to work on, we can create them without any complications. Though, if you want to come up with engaging and informative T chart illustrations, then consider using EdrawMax Online. It is a freely available online application that hosts a wide range of professionally drafted templates and vectors. You can access its extensive resources and work on all kinds of visual tools without any prior designing experience.
To learn how to come up with different T chart graphic organizers using EdrawMax Online, follow these steps:
Firstly, you should collect some vital information to draft your T Chart. For instance, you should know what you are comparing or analyzing and the crucial parameters to list. For instance, if you are working on a T chart of pros and cons, then just list it down on a piece of paper first.
Now, just go to the official website of EdrawMax online and log-in to your account. From here, you can just look for any readily available template on T Chart to save your time. You can also work on a blank canvas and import the needed vectors to the application. Furthermore, you can also alter the overall background, color scheme, and other details of the illustration as well.
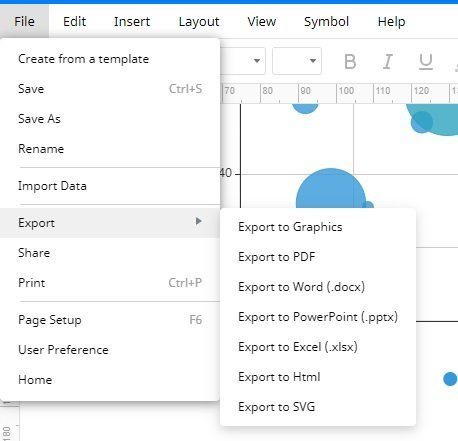
Lastly, just go to the menu option > File > Export and select a desirable format to export the T Chart you have just created. You can also upload it to Google Drive, Dropbox, or save it on your profile.
More Useful Graphic Organizers
Although T Charts are extremely beneficial and easy to draw, they have a few limitations. To overcome them, you can consider the following alternatives to a T Chart graphic organizer.
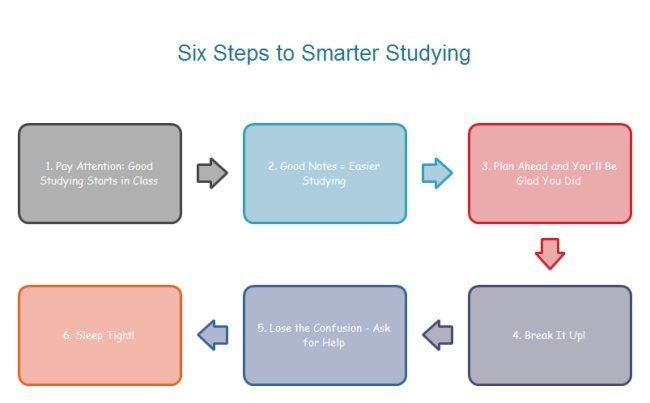
1. Sequence Chart
As the name suggests, a sequence chart is a chronological list that depicts a series of events by passing through various objects or actions. Since they provide a stepwise approach for a certain topic, they are easier to draw and understand. For instance, here you can see a sequence for studying smarter.
2. Storyboard
A storyboard is a vastly popular graphical tool that helps us depict or narrate a story to others. It follows a more visual and dynamic approach by taking the assistance of all kinds of graphics and illustrations to focus on a central idea. Since there are no strict rules with storyboards, we can create them in almost every possible way.
3. Grid and Matrix Graphic Organizer
A grid and matrix is an advanced form of the T Chart graphic organizer in which we have an intersection of rows and columns to form a matrix. In this way, we can compare multiple entities in one place on the basis of various parameters.
That’s it, everyone! After reading this extensive guide on what is a T Chart, you would be able to learn more about its examples and applications. To make things easier for you, I have also provided a tutorial on how to create a T Chart graphic organizer in this post as well. Go ahead and try EdrawMax Online and feel free to explore its features to create all kinds of illustrations with minimum efforts.


