A Complete Guide: Value Stream Mapping (VSM)
Create a VSM Online Free Free Download Free Download Free Download Free DownloadWhat is a value stream mapping?
So, what is value stream mapping? Any guesses?
Well, to meet the changing demands and increase of expectation of value to be delivered to customers, the concept of value stream mapping came to light. The process allows you to make a detailed visualization of work processes forwarded from a company to the end consumer in the form of values. Thus, by doing so, value stream mapping helps in process improvement as well as introspection for the products. A value stream map contains all the inputs and the resources you use to leverage to produce those goods or services.
As the value stream mapping is gaining popularity, so does you are required to create a value stream map for your work environment. If this is the case, your search ends here.
The article will provide you useful insights on the chapter of value stream mapping examples, and the valuable software to draw value stream maps instantly. So, stick with us and read below.
History of Value Stream Mapping
If you are also wondering where the term ‘value stream mapping’ comes from, then this history will exactly tell you the answer. The history accurately shows the name ‘Materials and Information Flow’ has become the term ‘value stream mapping’ after a long search and analysis over the concept. Actually, the historians have to update the VSM with downloading process programs, work instructions, uploading measurements and sensor readings, etc.
However, you should not rely on the misconception that Toyota invented this practice. VSM has become famous since the rise of Lean from the second half of the 20th century. The Lean made the Toyota a luminous manufacturing sensation, although the term VSM was not present at that time. The reality for value stream mapping shows us the records of diagrams with information and flow of materials in a 1918 book by Charles E. Knoeppel called ‘Installing Efficiency Methods.’
It is by the 1990s that value stream mapping has come to be part of the lives of many people, including the Western managers. The popularity of VSM has outgrown the manufacturing sector. Then, the concept started to develop in other industries like IT operations, marketing, software development, and many others.
Symbols and Terms of Value Stream Mapping
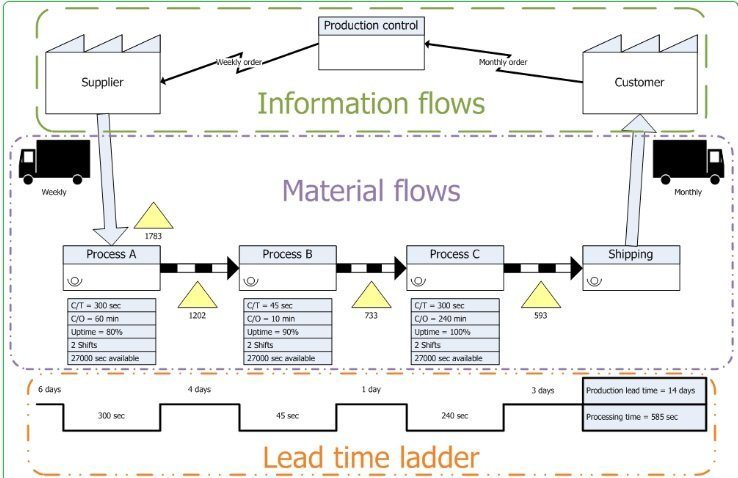
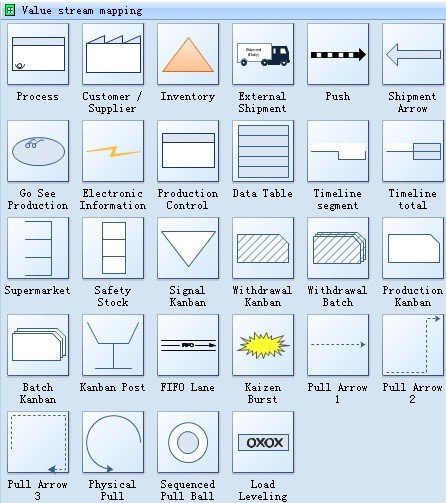
However, you can also create your logo. But there is a facility to use established symbols and terms in value stream mapping. They include the supplier, primary process, shipment, control, push data table shapes, information, and much more, as described below.
The process indicates a step in the flow of operations. It shows the level required to complete a service, product, or administrative function from order till delivery.
The supplier icon gets placed in the upper left corner of a value stream map. And, if you see the symbol on the top right corner, it depicts the customer. Suppliers need something in return also to make the change successful such as steady schedules, information, and a non-adversarial relationship.
They identify cycle time and changeover, rework, and labor.
The equilateral triangle indicates inventory in the value stream maps.
It is merely a set of interconnected queues and operations that starts with a supplier and ends with a customer.
It is used to compare and represent the two, but the timeline does not focus on consumed resources and generated waste for making the product.
You will see it at the bottom with the number of raw materials used in each process and the total amount of materials to add value from a customer's perspective.
This signal is sent upstream to several product families that share operation.
The concept is similar to signal kanban except that it is sent only for dedicated upstream resources.
This symbol is used to indicate the movement of different materials from the storage location or supermarket in small quantities.
It shows the quick processing of customer orders by eliminating the requirement for supermarket storage between different processes.
It shows the First-In-First-Out System with a limitation on inventory input. You can write the maximum capacity of inventory below the lane.
It shows the Kanban stock point where the upstream suppliers replenish the inventory to downstream customers based on their requirements.
These are the opposite of funnels with slow and steady incoming orders and materials and broad, intermittent outputs.
It depicts a large number of incoming materials and quick initial processing.
They contain the basic shape of the pipe required to represent flow and are on their way to become lean.
So, these are some of the symbols with their descriptions to let you understand the value stream mapping clearly.
Some Terms used in Value Stream Mapping
- C/T (Cycle Time)
- FTT (First Time Through)
- C/O (Changeover Time)
- NVA (None Value Added)
- VA (Value Added)
- L/T (Lead Time)
- T/T (Take Time)
- Capacity (Metric to indicate parts in the slowest process).
What is value stream mapping for?
The value stream mapping, used typically in Lean, comes with the fulfillment of the following purposes.
- In a value stream, valuable activities are shown separately from wasteful activities. So, the primary purpose is to show you the different places where you can make improvements in the work processes by visualizing the map.
- Another essential purpose of value stream mapping is to shorten the time as much as possible by ensuring to reduce the time taken for production until the transportation of goods or services. It also makes sure to check for any stick sitting in the way and eliminate that.
- By evaluating every step on the workflow value stream map, you can check for the value delivered to the end consumer.
Why is value stream mapping important?
The following are some of the recognized benefits of using value stream maps.
Value streaming mapping is essential because it helps you to identify different bottlenecks, or you can say constraints available within an information flow. It shows us who is responsible for specific misconduct or delaying happening in the workflow.
It is also one of the main aims of a value stream map to determine the wasteful or non-value adding activities within a process. The examples of wasteful activities include unbalanced workloads, duplicate processes, creating multiple copies of the same document, and unnecessary movement of materials, parts, documents, or files.
Value streams maps generate a kind of conversational starters and something to do about. It will let the team members think of the betterment to be made in processes and make the areas more efficient and well-structured. So, there will be lots of opinions and ideas for further enhancements in the workflow.
This team exercise lets people work together even if they are from cross-functional areas. They can now divert their minds on activities except their work perspective. In these cases, their opinions usually match and are on the same side to work for a central piece of objectives.
The process of creating value stream maps is reasonably easy to do with not much cost involved. However, if you build it on a piece of paper, no charge other than the knowledge is required. But, sometimes it becomes hectic to draw symbols and learn to make different symbols, thus using dedicated software will put you at ease.
How does value stream mapping work – Learn from VSP examples
Study the value stream mapping examples given below to get into a full insight on the concept.
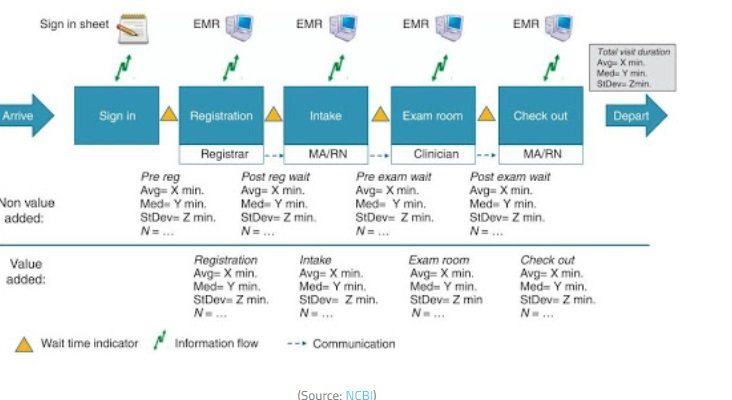
When we talk of the healthcare industry, note that 48% of hospital revenue comes from surgeries. It is where the value stream map helps the hospital to identify bottlenecks right from when the customer enters when the customer leaves. It is because any delay in operations or patient dissatisfaction can lead to catastrophic results.
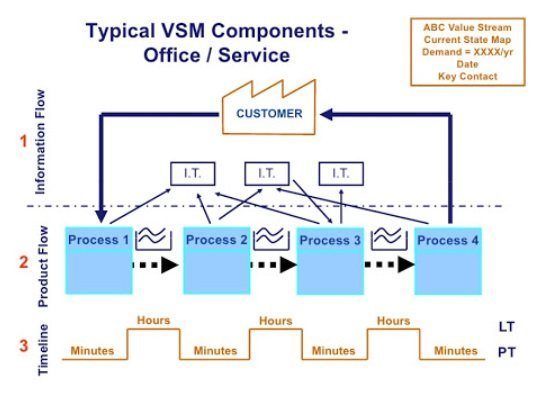
In offices, different necessary processes get scheduled or carried on a daily basis. However, the reality is even worst in the case of offices pointing out to the requirement of creating value stream maps.
You can take an example of inaccessibility to a computer network or loss of necessary software upon which all its operations are dependent.
Thus, value stream mapping helps to identify the issues and possible remedies to solve them.
Value Stream Mapping for Dummies: How to create a VSP with Edraw step by step
Edraw helps you create the value stream maps with available symbols and templates.
First, you have to determine the type of industry for which you need to create a map and the reasons why you are doing this process. It will help you better analyze the plan.
After doing so, follow the simple steps given below for creating a fantastic value stream map.
Edraw software offers symbols and templates to help create the value stream map. So, first click on File, then New, Business Diagram, and lastly, Value Stream Map.
Move on to drag and drop the Value Stream Map shapes from the library panel.
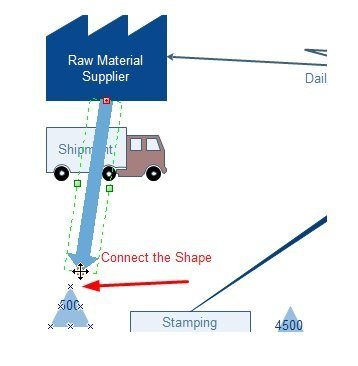
The last step is to use a connector to connect different shapes to show the flow of information of materials or services onto the page.
新 10012310 旧 11267 9542 9543 9544 9891
What is a value stream mapping?
So, what is value stream mapping? Any guesses?
Well, to meet the changing demands and increase of expectation of value to be delivered to customers, the concept of value stream mapping came to light. The process allows you to make a detailed visualization of work processes forwarded from a company to the end consumer in the form of values. Thus, by doing so, value stream mapping helps in process improvement as well as introspection for the products. A value stream map contains all the inputs and the resources you use to leverage to produce those goods or services.
As the value stream mapping is gaining popularity, so does you are required to create a value stream map for your work environment. If this is the case, your search ends here.
The article will provide you useful insights on the chapter of value stream mapping examples, and the valuable software to draw value stream maps instantly. So, stick with us and read below.
History of Value Stream Mapping
If you are also wondering where the term ‘value stream mapping’ comes from, then this history will exactly tell you the answer. The history accurately shows the name ‘Materials and Information Flow’ has become the term ‘value stream mapping’ after a long search and analysis over the concept. Actually, the historians have to update the VSM with downloading process programs, work instructions, uploading measurements and sensor readings, etc.
However, you should not rely on the misconception that Toyota invented this practice. VSM has become famous since the rise of Lean from the second half of the 20th century. The Lean made the Toyota a luminous manufacturing sensation, although the term VSM was not present at that time. The reality for value stream mapping shows us the records of diagrams with information and flow of materials in a 1918 book by Charles E. Knoeppel called ‘Installing Efficiency Methods.’
It is by the 1990s that value stream mapping has come to be part of the lives of many people, including the Western managers. The popularity of VSM has outgrown the manufacturing sector. Then, the concept started to develop in other industries like IT operations, marketing, software development, and many others.
Symbols and Terms of Value Stream Mapping
However, you can also create your logo. But there is a facility to use established symbols and terms in value stream mapping. They include the supplier, primary process, shipment, control, push data table shapes, information, and much more, as described below.
The process indicates a step in the flow of operations. It shows the level required to complete a service, product, or administrative function from order till delivery.
The supplier icon gets placed in the upper left corner of a value stream map. And, if you see the symbol on the top right corner, it depicts the customer. Suppliers need something in return also to make the change successful such as steady schedules, information, and a non-adversarial relationship.
They identify cycle time and changeover, rework, and labor.
The equilateral triangle indicates inventory in the value stream maps.
It is merely a set of interconnected queues and operations that starts with a supplier and ends with a customer.
It is used to compare and represent the two, but the timeline does not focus on consumed resources and generated waste for making the product.
You will see it at the bottom with the number of raw materials used in each process and the total amount of materials to add value from a customer's perspective.
This signal is sent upstream to several product families that share operation.
The concept is similar to signal kanban except that it is sent only for dedicated upstream resources.
This symbol is used to indicate the movement of different materials from the storage location or supermarket in small quantities.
It shows the quick processing of customer orders by eliminating the requirement for supermarket storage between different processes.
It shows the First-In-First-Out System with a limitation on inventory input. You can write the maximum capacity of inventory below the lane.
It shows the Kanban stock point where the upstream suppliers replenish the inventory to downstream customers based on their requirements.
These are the opposite of funnels with slow and steady incoming orders and materials and broad, intermittent outputs.
It depicts a large number of incoming materials and quick initial processing.
They contain the basic shape of the pipe required to represent flow and are on their way to become lean.
So, these are some of the symbols with their descriptions to let you understand the value stream mapping clearly.
Some Terms used in Value Stream Mapping
- C/T (Cycle Time)
- FTT (First Time Through)
- C/O (Changeover Time)
- NVA (None Value Added)
- VA (Value Added)
- L/T (Lead Time)
- T/T (Take Time)
- Capacity (Metric to indicate parts in the slowest process).
What is value stream mapping for?
The value stream mapping, used typically in Lean, comes with the fulfillment of the following purposes.
- In a value stream, valuable activities are shown separately from wasteful activities. So, the primary purpose is to show you the different places where you can make improvements in the work processes by visualizing the map.
- Another essential purpose of value stream mapping is to shorten the time as much as possible by ensuring to reduce the time taken for production until the transportation of goods or services. It also makes sure to check for any stick sitting in the way and eliminate that.
- By evaluating every step on the workflow value stream map, you can check for the value delivered to the end consumer.
Why is value stream mapping important?
The following are some of the recognized benefits of using value stream maps.
Value streaming mapping is essential because it helps you to identify different bottlenecks, or you can say constraints available within an information flow. It shows us who is responsible for specific misconduct or delaying happening in the workflow.
It is also one of the main aims of a value stream map to determine the wasteful or non-value adding activities within a process. The examples of wasteful activities include unbalanced workloads, duplicate processes, creating multiple copies of the same document, and unnecessary movement of materials, parts, documents, or files.
Value streams maps generate a kind of conversational starters and something to do about. It will let the team members think of the betterment to be made in processes and make the areas more efficient and well-structured. So, there will be lots of opinions and ideas for further enhancements in the workflow.
This team exercise lets people work together even if they are from cross-functional areas. They can now divert their minds on activities except their work perspective. In these cases, their opinions usually match and are on the same side to work for a central piece of objectives.
The process of creating value stream maps is reasonably easy to do with not much cost involved. However, if you build it on a piece of paper, no charge other than the knowledge is required. But, sometimes it becomes hectic to draw symbols and learn to make different symbols, thus using dedicated software will put you at ease.
How does value stream mapping work – Learn from VSP examples
Study the value stream mapping examples given below to get into a full insight on the concept.
When we talk of the healthcare industry, note that 48% of hospital revenue comes from surgeries. It is where the value stream map helps the hospital to identify bottlenecks right from when the customer enters when the customer leaves. It is because any delay in operations or patient dissatisfaction can lead to catastrophic results.
In offices, different necessary processes get scheduled or carried on a daily basis. However, the reality is even worst in the case of offices pointing out to the requirement of creating value stream maps.
You can take an example of inaccessibility to a computer network or loss of necessary software upon which all its operations are dependent.
Thus, value stream mapping helps to identify the issues and possible remedies to solve them.
Value Stream Mapping for Dummies: How to create a VSP with Edraw step by step
Edraw helps you create the value stream maps with available symbols and templates.
First, you have to determine the type of industry for which you need to create a map and the reasons why you are doing this process. It will help you better analyze the plan.
After doing so, follow the simple steps given below for creating a fantastic value stream map.
Edraw software offers symbols and templates to help create the value stream map. So, first click on File, then New, Business Diagram, and lastly, Value Stream Map.
Move on to drag and drop the Value Stream Map shapes from the library panel.
The last step is to use a connector to connect different shapes to show the flow of information of materials or services onto the page.