How to Create a Value Stream Map in Excel
A value stream map is also known as a material and information flow map. It is a lean management method of analyzing the design and stage of a future state of a product or service from the beginning until reaching the consumers. In simple words, it is a type of visual representation that represents the steps involved in the journey of a product from the beginning until it is delivered to customers. You can easily visualize and organize every task that is required to deliver the product to its final customer. Visual stream maps are used in different fields like manufacturing industry design and development fields and service industries. VSM helps eliminate waste, add value, and improve product quality.
In this article, you will find out how to create value stream mapping in Excel, but first, let's discuss the importance of VSM.
How VSM Is Used In Different Fields
As stated earlier, VSM is used in different fields where uh they have different objectives. Here are the functions of VSM in various industries:
- Office And Administrative
- Supply Chain And Logistics
- Manufacturing Industry
- Service Industries
- Software Engineering And Development
VSM is used in the office and administrative area to identify wasteful steps and enhance the service provided within a business to its internal customers.
VSMs are used in supply chain and logistics to get rid of any waste and costly delays at different steps in the supply chain.
VSM is used in the manufacturing industries to speed up the production process by analyzing each step of material handling.
The function of VSM in the service industry is to improve the value of the product and find waste in every activity required to carry out the service.
VSM is used in software engineering and development to find and locate inefficiencies in the development process from ideation two reworking.

How to Create a Value Stream Map in Excel
A value stream map is a highly complex and advanced chart which should only be created by professionals using proper diagrammatic tools. VSM is not feasible because MS Excel lacks the proper tools and features to create a value stream map. Hair reasons why you can't create value stream mapping in Excel:
- VSM Symbols Not Available
- Inefficient And Time-Consuming
Microsoft Excel does not include VSM symbols necessary to create this type of chart. These symbols include the VSM information symbol, material symbols, process symbols, and other general symbols needed for a VSM.
Microsoft Excel is primarily data processing software and not a drawing tool; therefore, it is not suitable for industrial charts. It is why when you try to create charts and diagrams on MS Excel, it can be very inefficient and time-consuming.
To help you create a VSM which you can use in Excel, we recommend using Edraw Max online. Edraw Max is a professional diagrammatic tool that allows you to create a number of industrial charts quickly and easily.
How to Create VSM in Edraw Max
Follow this guide to create value stream mapping using Edraw Max:
Step 1: Launch Edraw Max
To create a VSM, first of all, open your browser and go to Edraw Max Online..
Step 2: Select Template
Once Edraw Max Online is launched on your browser, scroll down to “management” and select value stream mapping. You will see different value stream mapping templates.
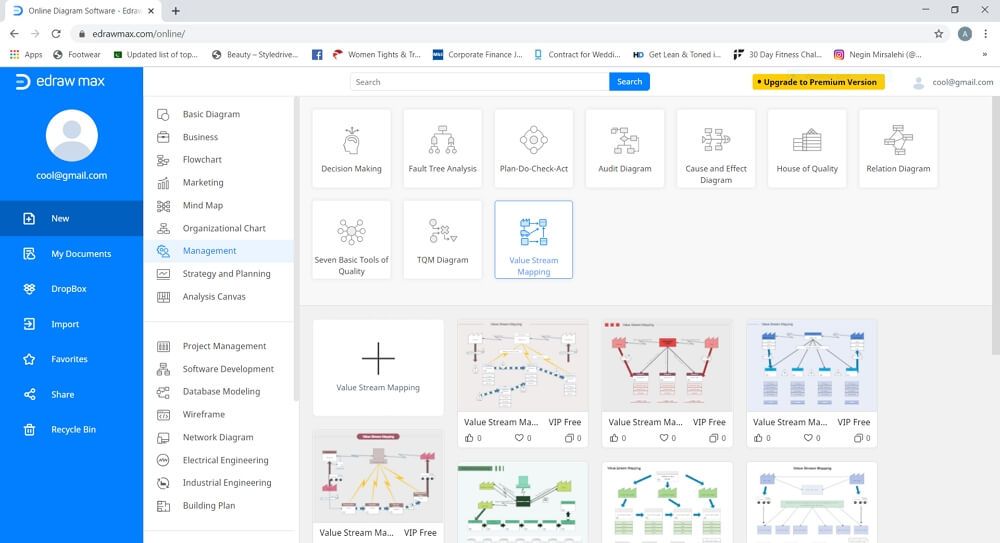
Now, you can either create a value stream map from scratch by clicking on the blank template or use one of the templates and customize it.
Step 3: Create Value Stream Mapping
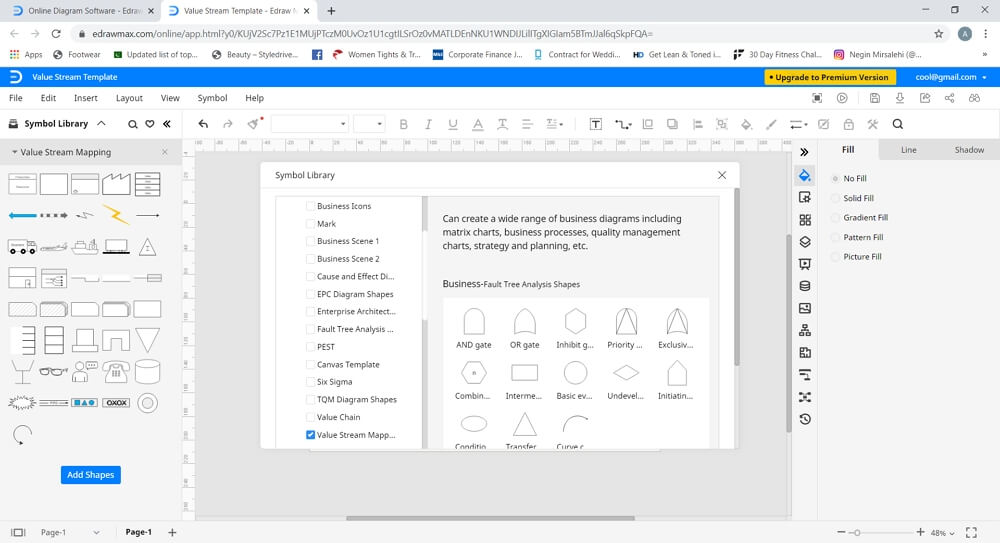
• Using a blank template
To create value stream mapping using the blank template, arrange value stream mapping symbols, and join them with connectors to create a basic map. You can add relevant text and edit your math from the formatting Tab on the right side of the screen. To add more symbols and icons, used the symbol library on the left side of the screen.
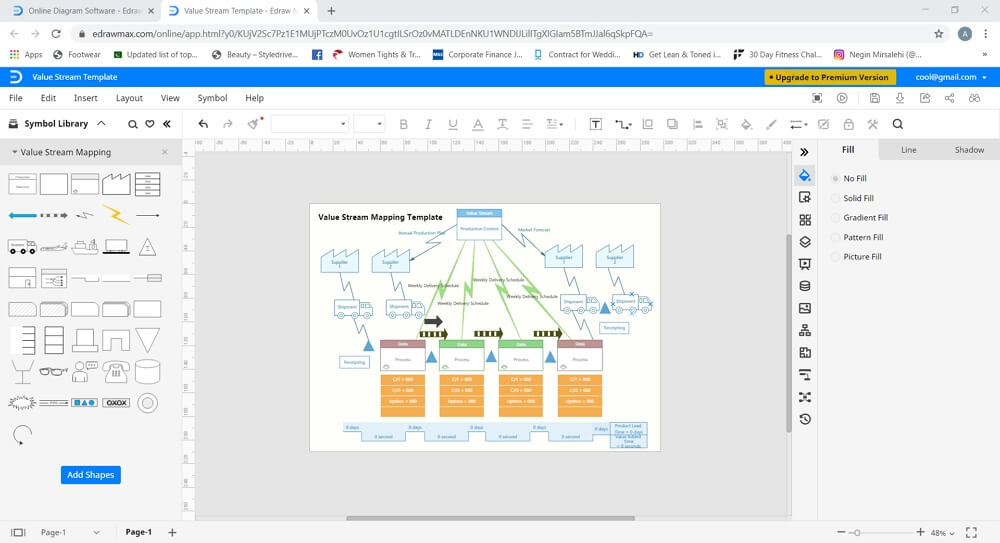
• Using Premade Template
To create value stream mapping from a template, click on any of the free templates. The template will launch in a new drawing Tab on your browser. Use the different tools available in Edraw Max online to customize your VSM according to your requirements.
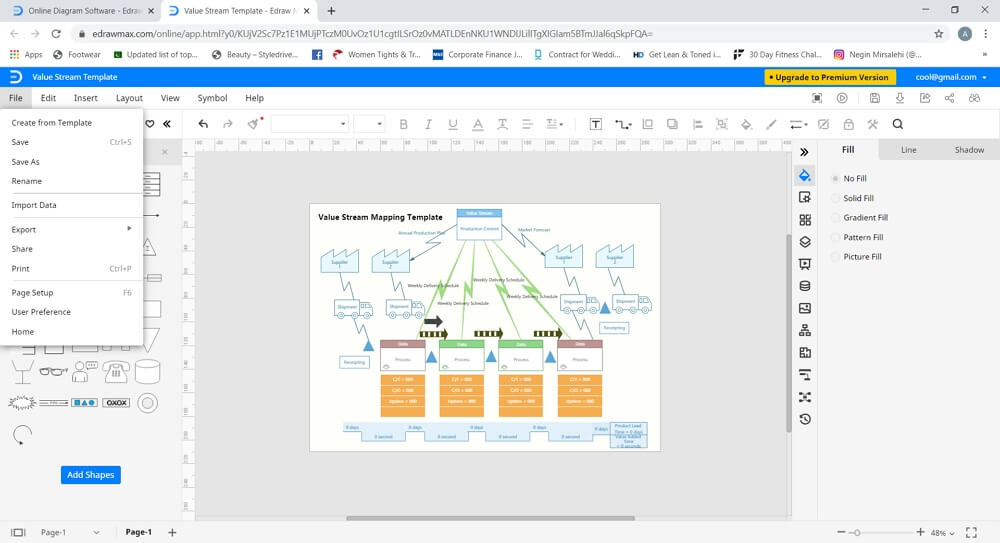
Steps 4: Edit and Customize
Keep editing and customizing your VSM until you are happy with it.
Step 5: Save and Export
Edraw Max Online offers a cool export feature that allows you to save your file in commonly used file types. It means that you can also save your VSM in excel file format and use it in MS Excel.
In this way you can create value stream mapping in Excel using Edraw Max online software.
VSM are essential tools in the manufacturing and development industries. Many professionals create VSM using Excel; however, it is inefficient and inconvenient. But with the help of Edraw Max Online, you can now create value stream mapping and then use those charts in MS Excel with the excellent export feature of Edraw.
Edraw Max also offers many cool features like:
- Free editable templates
- Cloud storage services
- Cross-platform support
- Abundant symbols


