UML Activity Diagram Explained
Create a Activity Diagrams Online Free Free Download Free Download Free Download Free DownloadWhat Is an Activity Diagram in UML?
UML diagram software allows a user to illustrate and visualise a system’s design. UML started off as a software system modeller, but has become more widely used in business and non-technical settings, as it has the added benefit of depicting a system’s dynamic aspects.
Activity Diagrams, along with Use Case, State Machine, and Interaction Diagrams, are behavior diagrams in UML (Unified Modeling Language). They model what actions and workflows happen in a particular system or piece of software.
What is the distinction between these diagrams? Use Case and State Machine Diagrams are used to show the workflow from one object to another, while activity diagrams and interaction diagrams are used to show the workflow from one activity to another. In other words, activity diagrams depict how a system operates. This allows you to better understand the workflows of the system, and what are the causes and limitations of certain events within that system.
Why Use an Activity Diagram?
Activity diagrams are typically used for the following purposes or in the following scenarios:
- To clearly illustrate the sequence and logic of activities in a system
- To illustrate business processes between a user and the system
- To modelling method, function, operation, and other software elements
- To show concurrent activities occurring
- To capture a system’s dynamic elements
Shapes, Symbols and Notations in Activity Diagram
As with any diagram, shapes, symbols and notation are used, here are some commonly used ones in an activity diagram.
|
Initial Node
The beginning of a workflow. |
|
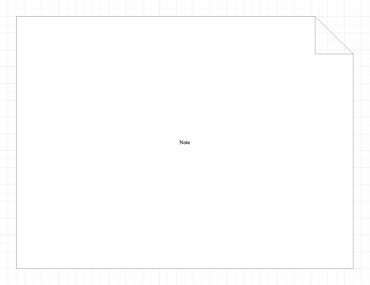
Note
Used to include notes for other users that can’t be communicated within the diagram itself. |
|
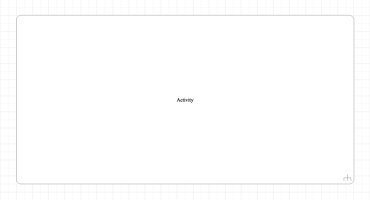
Action/Activity
A rounded box used to illustrate the occurrence of an action or event. |

|
Decision or Merge/Branch
A diamond symbol used when there are at least two alternate paths for the user to choose from. |
|
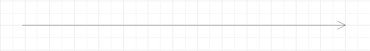
Action/Control Flow
Shown by an arrow connecting one action box to another. |
|
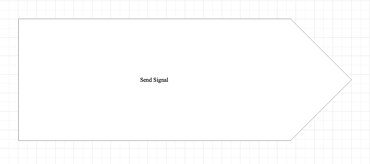
Send Signal
A receiving activity is required to fulfil this signal. |
|
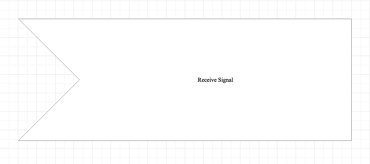
Receiving Signal
The activity flow noted by “Send Signal” has been accepted and completed. |
|
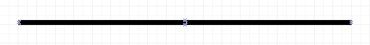
Fork Symbol
|

|
Flow Final
The end of a specific process flow, but not the end of all activity. |

|
End Symbol
Completion of all process flows. |
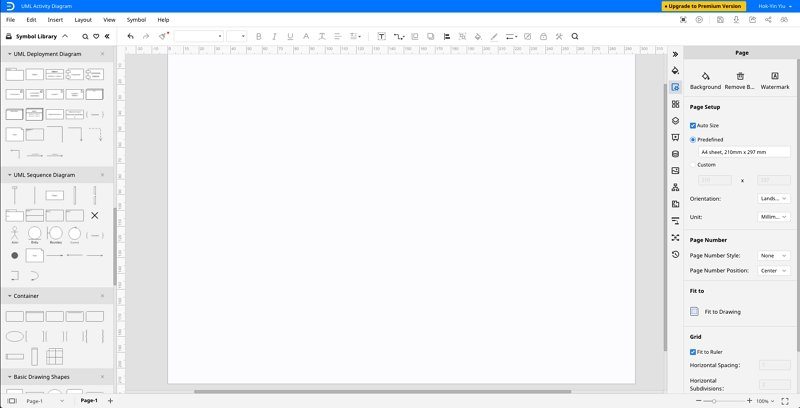
How to Draw an Activity Diagram in Edraw Max?
Edraw Max’s intuitive software allows you to create your own activity diagrams. Whether it’s a basic or complex one, follow this outline to create one that fits your needs.
- Step 1: In your browser, visit https://www.edrawmax.com/online/ to access the online version, or download the desktop version at https://www.edrawsoft.com/download-edrawmax.html
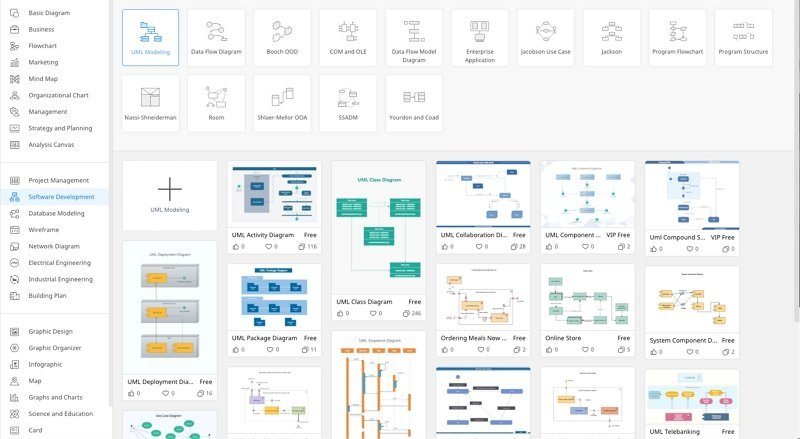
- Step 2: In the white sidebar, click on Software Development. Then, click on the UML Modelling box that appears near the top of the screen.
- Step 3: Choose a template, or click on the UML Modelling box with the “ + ” to open a new document.
- Step 4: The symbol library can be found to the left of the screen. Scroll down further to find more UML-related symbols.
- Step 5: Simply drag the components you need from the symbol library onto the blank document to start creating. Each element can be moved, resized, or customized to fit your needs.
Activity Diagram Examples
Here are two examples of UML activity diagram created on Edraw Max.
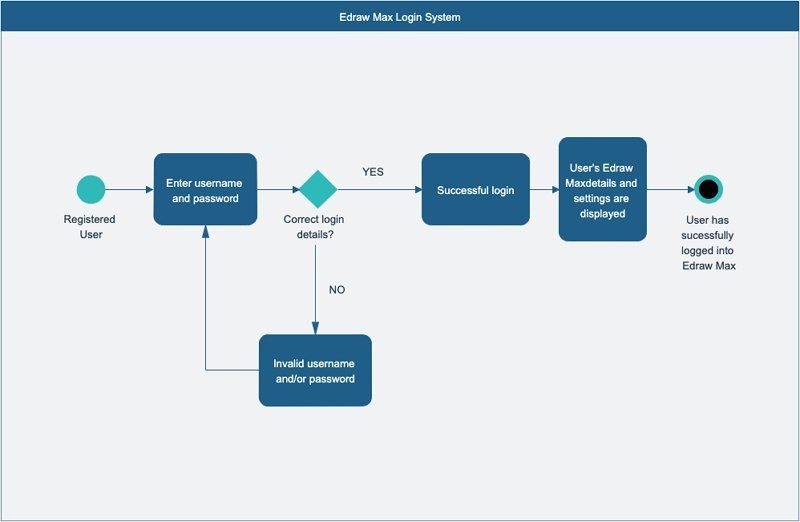
Diagram 1: Edraw Max Login System
This is an example of how a Decision or Merge/Branch symbol might be used in an activity diagram. Here, the user may end up at one of two outcomes: he enters the correct login details and proceeds to successfully log in, or he enters the wrong login details and is taken back to the previous Action.
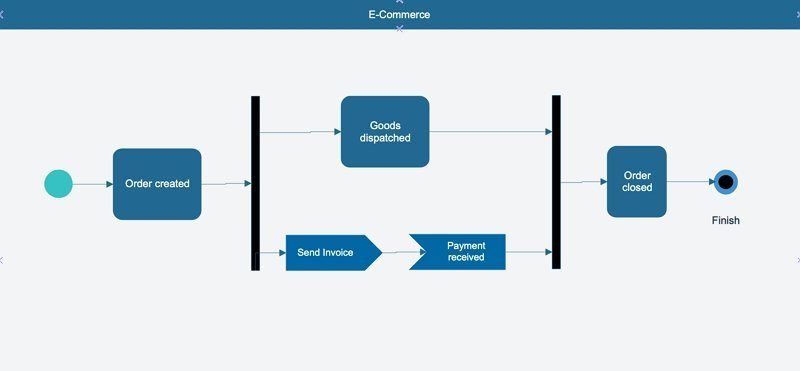
Diagram 2: E-commerce order processing
An example of how fork symbols, Send Signals and Receive Signals might be used in an e-commerce situation where a customer places an order online.
Activity Diagrams vs. Flowcharts: What’s the Difference?
Activity diagrams show the flow of one activity to another. It is used in UML to model a system, typically software. They also have the distinction of being able to depict concurrent activities, commonly through a wider variety of notations including swimlanes, branching, parallel flow, control nodes, expansion nodes, and object nodes.
On the other hand, a flowchart is simply a step-by-step diagram showing a user how to solve a problem. It lacks the ability to depict the dynamic elements of a system or software, namely the occurrence of concurrent activities.
Summary
Activity diagrams are an extremely useful way for you to illustrate and visualise business flows. It does more than a basic flowchart, depicting the dynamic nature of a system and a sequence of activities. It allows you to better understand a system or software as a whole, and lets you know which areas need improving by breaking down complex processes into smaller activities. Use Edraw Max to create your own activity diagrams now!


