What is A Flowchart - A Complete Guide
Create a Flowchart on Edraw.AI Online Free Free Download Free Download Free Download Free DownloadMany-a-times, you may find specific processes challenging to understand. In such circumstances, a flowchart can be of great help to you.
What is a flowchart?
A flowchart is a graphical representation of a procedure or algorithm in the form of a diagram. You can convert a complex process into a bright and straightforward method using a flowchart and make it understandable. Besides, if you need to frame a flowchart, you do not need a professional. Instead, you can create it in your way. Flowchart symbols like a diamond, round, parallelogram, give life to a dead diagram. So, let us move forward to know the types of flowcharts and how to make a flowchart in the upcoming sections.
Why do we need a flowchart?
You can use flowcharts in numerous fields and categorize their advantages wholly in the following points:
- Effective documentation: Without giving any chances for paper works, you can do sufficient documentation of the other process. Besides, you can conduct training with the aid of a flowchart. This advantage can get mainly observed in organizations, both small and big.
- Clarity of the process: If a new process or project is about to begin, creation of a flowchart is the first step. The step-by-step procedure and the possible outcomes of each method will be clearly stated, leaving no chance for confusions and future doubts. Moreover, flowcharts provide visual clarity.
- Improved problem solving: When you make a flowchart, problem-solving and bug fixing becomes an easy task. You can break an issue into parts and define flowcharts separately. You can mention all the possible solutions and their outcomes. Then pick up the optimized solution making it cost-effective and time conserving.
- Effective communication and co-ordination: At present, team meetings are getting replaced by flowcharts. Yes, rather than arranging team meetings and wasting time in them, a framed flowchart depicting the actual process and expected performance with the deadline is being circulated.
- Analysis & Improvement: You can also use a flowchart or diagram to analyze the ongoing process effectively and compare the performance with the expected one. If you find any deviation, you can pitch-in steps for improvement.
Types of Flowcharts
As discussed in the first session, there are various types of flowcharts. You will find the detailed list below.
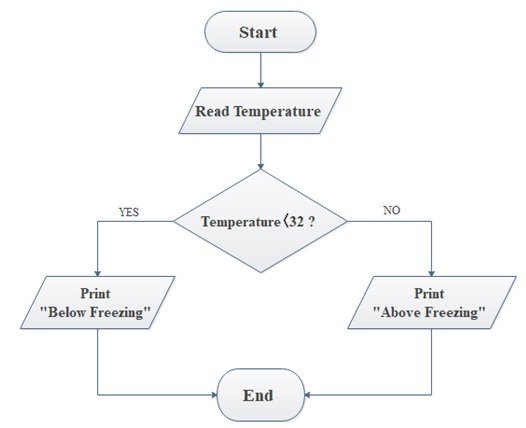
A basic flowchart is the most straightforward form to understand. Usually, a small process of one functionality follows a basic flowchart/diagram of almost five steps only.
 below.
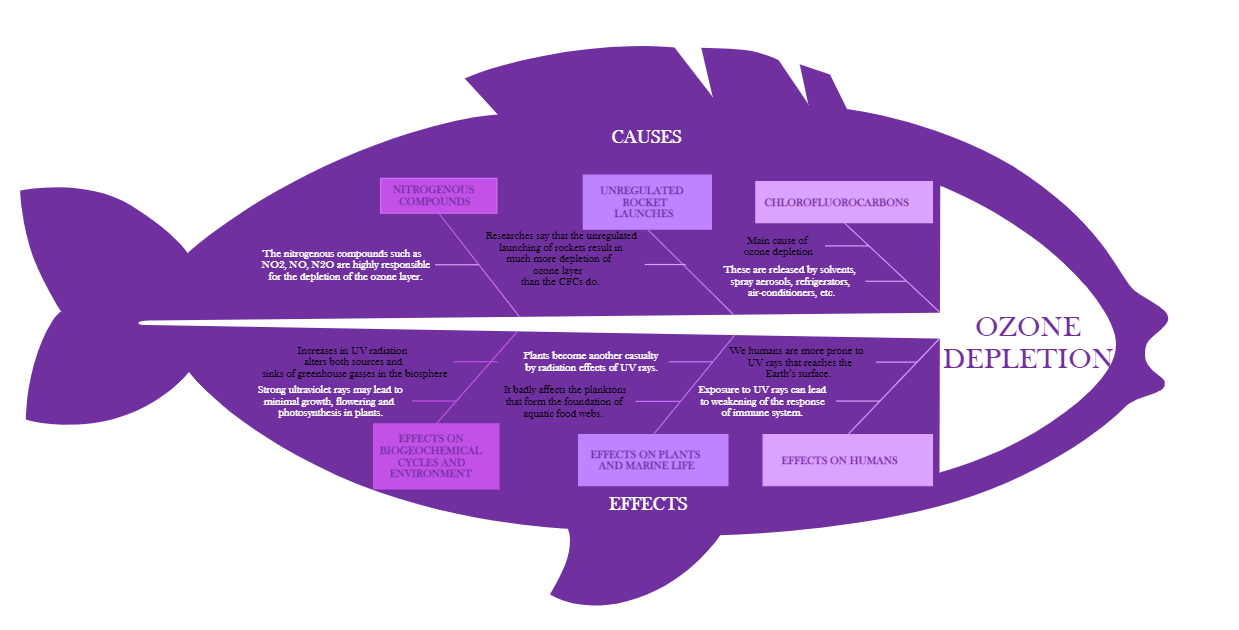
 Cause and effect diagram or fishbone diagram is convenient when you get confused with which step to take or path to follow. When various levels are available to execute a process, each pace gets listed with its effects that it might bring in the later stage helping to stick on the better one.
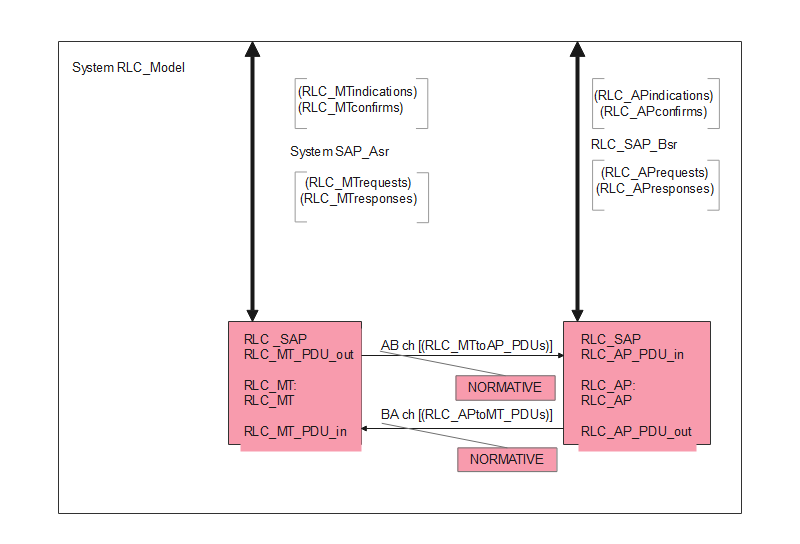
SDL is a high-level language diagram used in communications, medical, and automation fields. It is defined using Specification and Description Language and supports UML, simulation, etc.
Rather than concentrating on the controls, specific processes focus on the channel path through which the entire process goes on. For facilitating such data flow, this diagram is highly useful.
It is sometimes mandatory to create highlight flowchart in which processes get highlighted with professional templates. They give more improved clarity and attracts the reader’s attention as well.
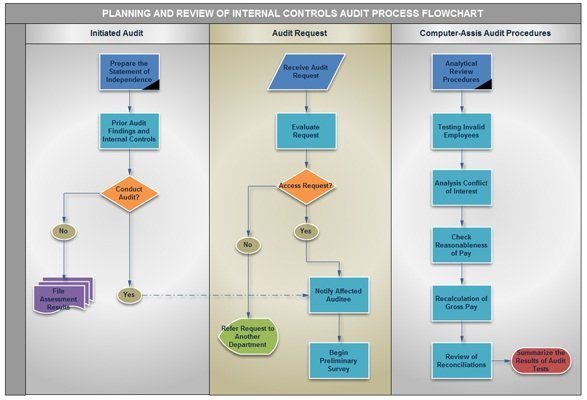
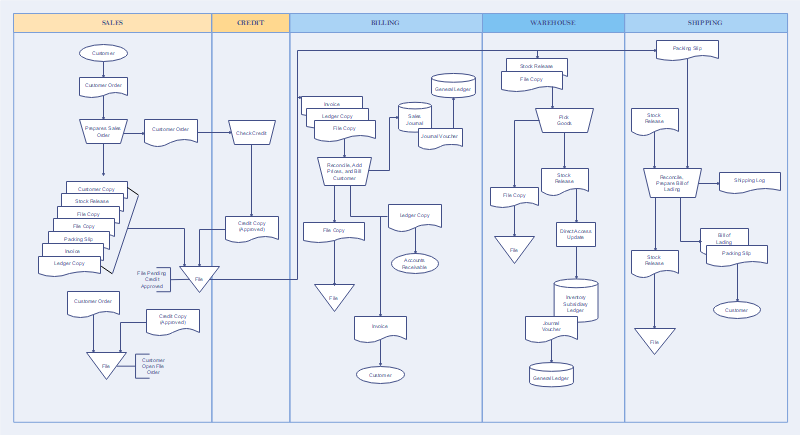
True to its name, the Audit diagram is more prevalent in areas like finance, account, money management, business inventories and other finance-related standard formulation like ISO 9000, and Document 6 Sigma.
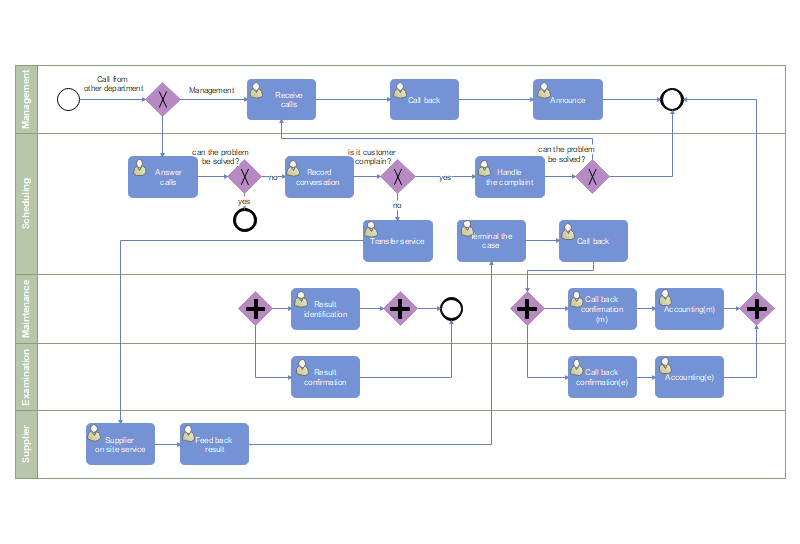
The concept of “Swimlanes” gets used in modeling this type of flowcharts implemented in business processes. You cannot express a whole business process in a single model, and hence, you need to make various notations for multiple functionalities.
A system organization and connection needs action in a flow, and hence such system flowcharts are predominant in programs and processors.
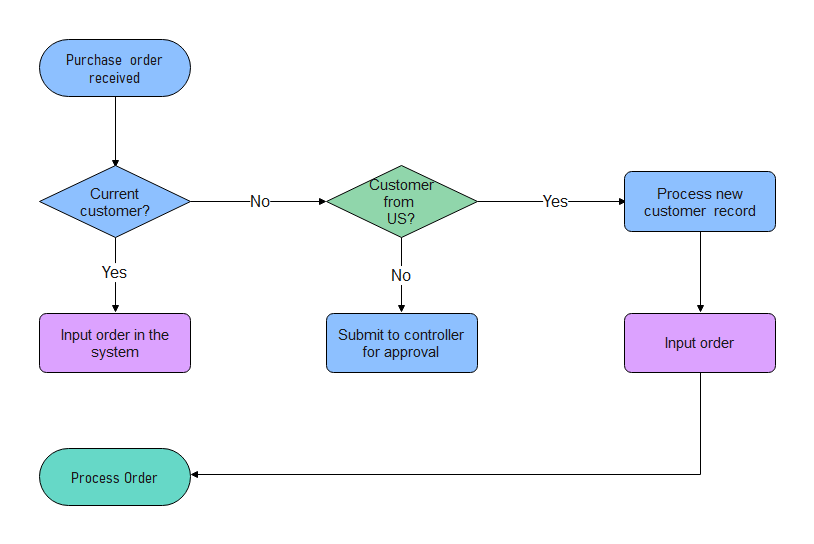
Cross-functional flowcharts find application in functional places where there is interconnection between the process or flow of control and various other departments within an organization. The functionality is multi and hence needs to be designed correctly.
Various functionalities of the Workflow diagram include the location of issues, correlating the relationships between interconnected steps, and understanding the whole process.

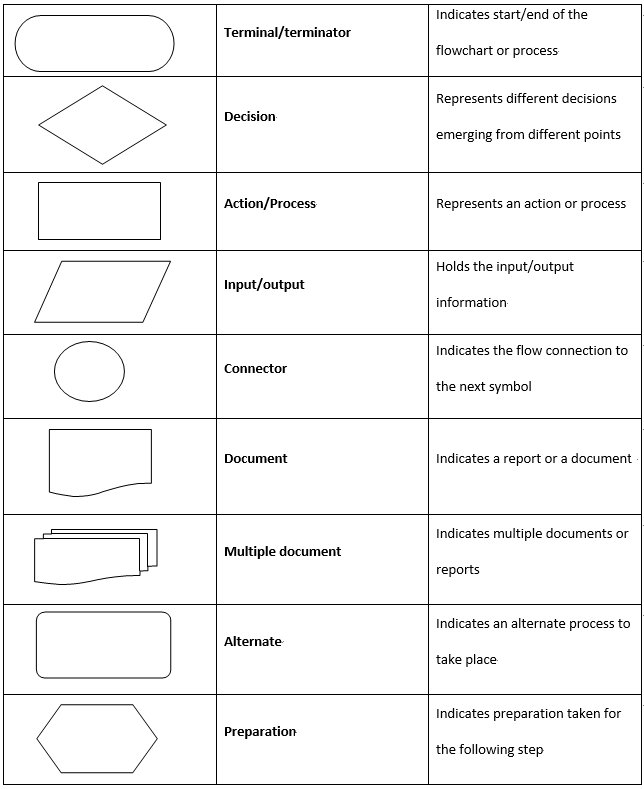
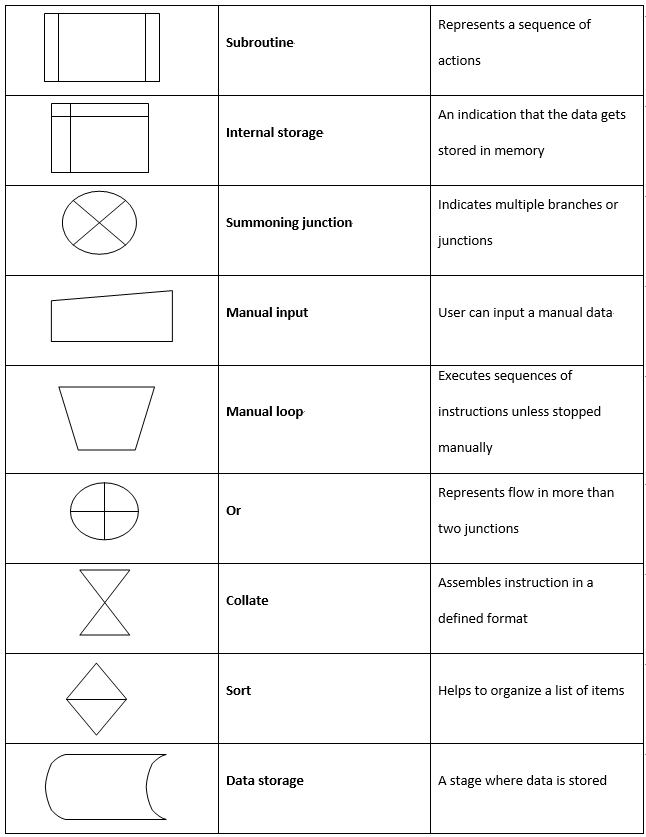
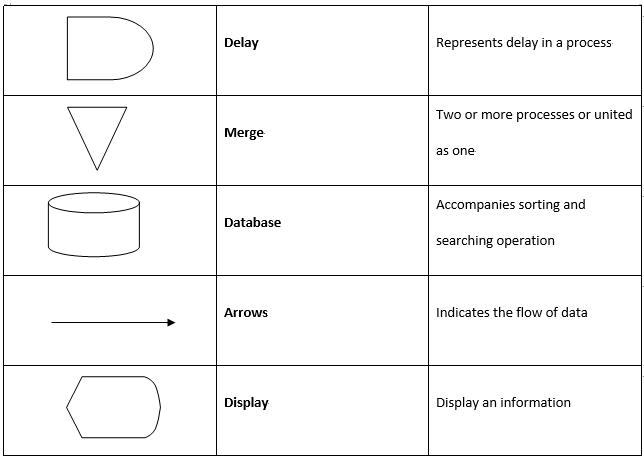
Flowchart Symbols
Flowchart symbols are distinct that have the pre-defined functionalities.
Flowcharts for Various Uses
Creating and executing codecs in computer programming is one of the riskiest tasks as unexpected bugs difficult to troubleshoot may arise. In such circumstances, as a precaution, we need to frame a flowchart in advance before programming code for the particular process or system. It might lend a hand in finding issues and other possible ways to carry over the code format.
- Visual clarity over the implementation of code
- Demonstrating the structure of the system
- Understanding the way users navigate or use the program
Source: https://www.smartdraw.com/flowchart/flowchart-programming.htm
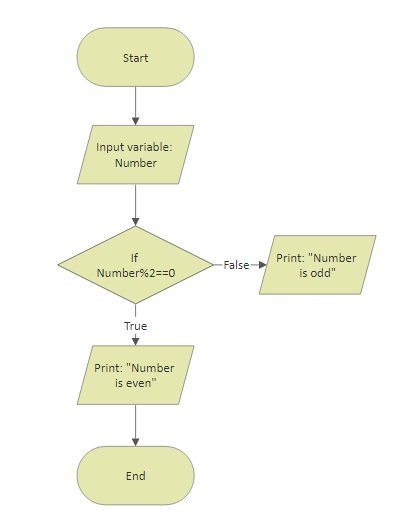
We have used a simple flowchart for computer programming as an example in this session. An input number is taken and divided by 2. If the remainder is equal to zero, the number is even, else printed as odd. A simple program flowchart is easily understandable.
The flowchart or diagram in business organizations is more common at present. It helps in:
- Organizing daily tasks for each employee
- Understand the process and making plans accordingly
- Formulating alternative plans and paths when the process collapses
- Follow-up of all the allocated tasks and comparing their performance with the expected output
- Documentation of the process for future and easier understanding
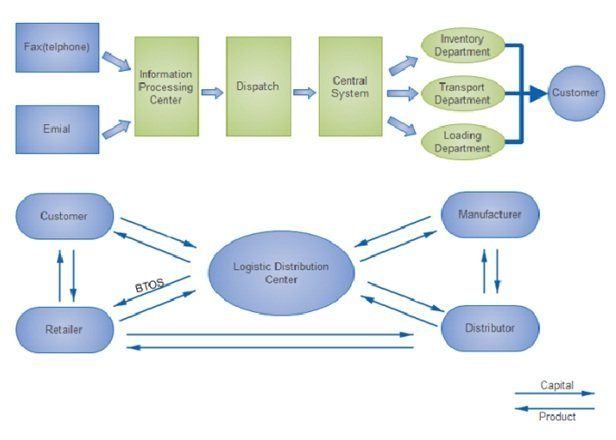
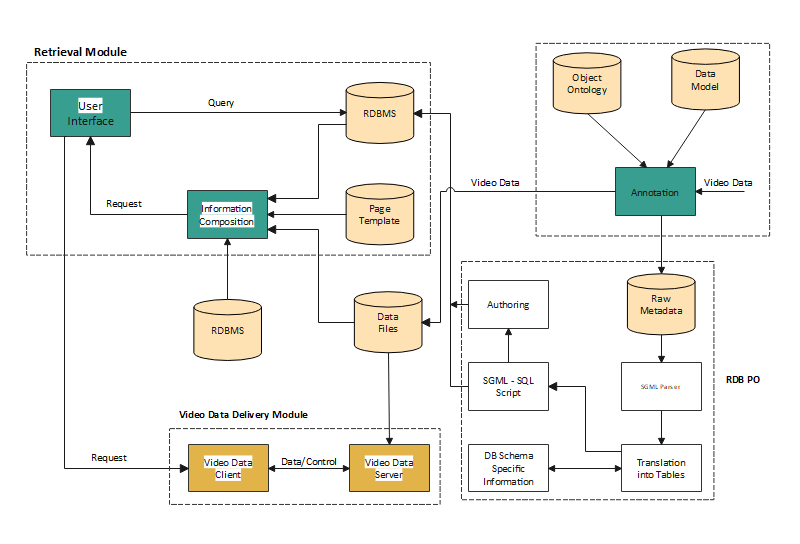
The above interface is an example of a flowchart for a logistic distribution business. It includes the relationship and flow of customers, retailers, manufacturer, and distributor. The information is processed in the center, dispatched and reaches the customer.
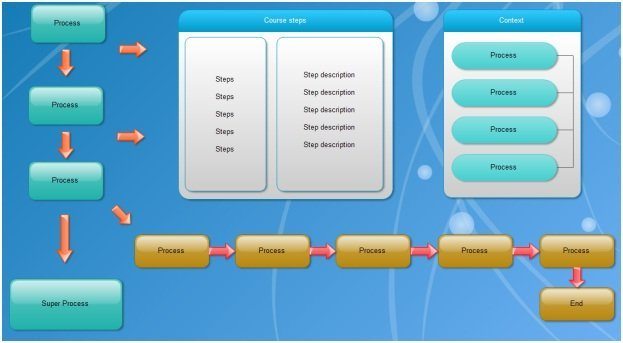
Education is the most unbeatable functional area where the flowchart/diagram finds various and different dimensions of usages.
- Effective planning of coursework and academic activities
- Creation of understandable guide
- Easy understanding of theories and hypothesis
- Chart out process like digestion, photosynthesis
- Demonstration of character types in film and literature
Source: https://www.visual-paradigm.com/tutorials/flowchart-tutorial/
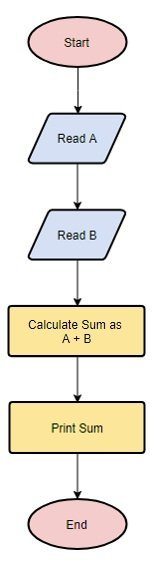
Here is a simple and basic flowchart that depicts the process of addition of two numbers. We first read the values, calculate the sum by performing addition, and print the value. Thus, we discussed the use of the flowchart in three major functional areas with suitable examples.
How to create a flowchart/diagram with EdrawMax?
Are you working on a process for a long time but are stuck somewhere in the middle? Well, no worries as we can quickly sort it out by creating your flowchart with the help of software like EdrawMax.If you want to know how to create a flowchart with EdrawMax, then this session will be useful for you.
- Step 1: Download and install the software.
- Step 2: On a blank drawing page, execute File> New>Flowchart and select your desired flowchart template.
- Step 3: There is a built-in library on the left from where you can drag and drop the symbols and resize them or change their style. Then, connect all the blocks in sequence.
- Step 4: Start adding the contents within the symbols by double-clicking on them.
- Step 5: Now, change the theme of your created flowchart structure. Add text style, fill color, and enhance them further.
- Step 6: Save the flowchart in your PC or Cloud. You can export it if needed.
Tips to Make a Flowchart Easily
In this section, we will give some essential tips on how to make a flowchart easily without any prior knowledge. First of all, you must ensure you know the below:
- What is the actual process?
- In what flow the work plan or process goes on?
- You need to follow a step-by-step guide.
- The alternate path and decisions you may need to take.
- Will you be able to achieve the result?
Remember, the main reason behind the creation of the flowchart or diagram should be sharp and clear so that the flowchart can get created without any hassle.


