Data Flow Diagram in Software Engineering
This article will dive into the data flow diagram in software engineering, and discuss some of its examples plus rules to create it. We will also learn how to create a data flow diagram and discuss some of the data flow diagram makers available online, like EdrawMax, a software engineer's first choice when creating a detailed diagram of any Information.
1. What is a Data Flow Diagram?
A data flow diagram is a visual representation of the flow of information for a process or a system. It is a mirror image of the whole system or a plant. The data flow diagram helps the engineers and plant workers to plan the work efficiently by picturizing the entire system. Creating a data flow diagram is a good practice adopted by almost all manufacturers, industries, software houses, and other institutions. It can be used as a tool for communication between a system analyst and everyone involved in the order that serves as a beginning point for system change. The goal is to demonstrate the breadth and bounds of a system as a whole.
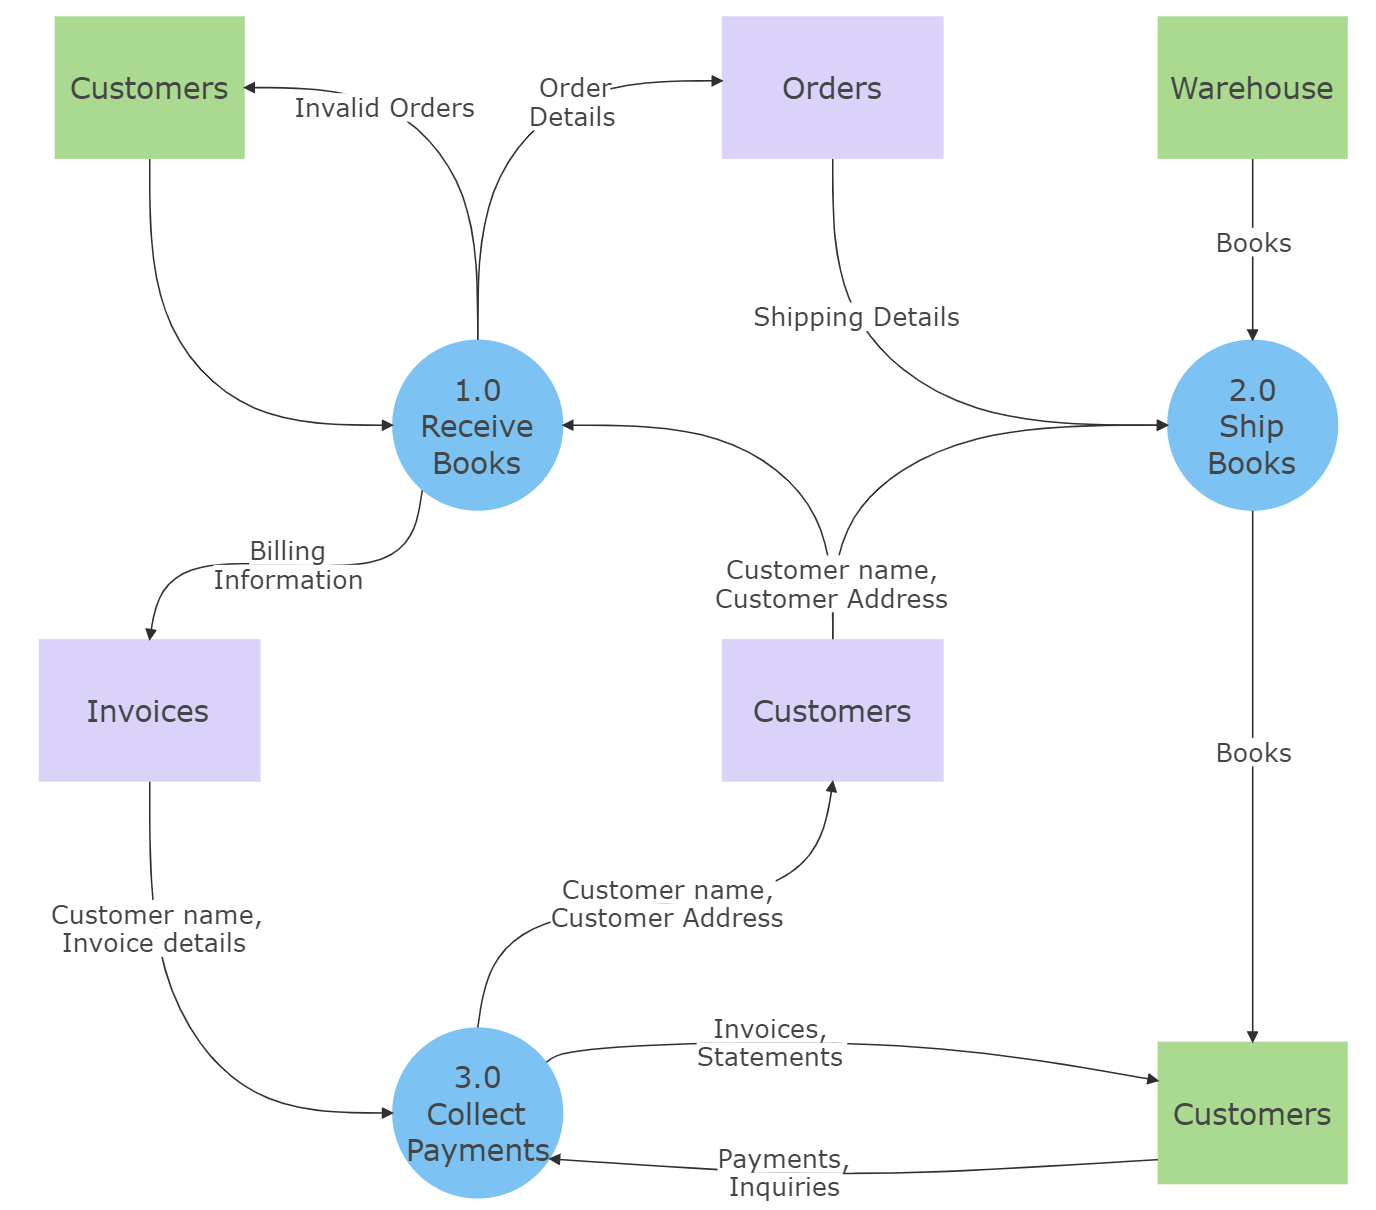
Click on the image to edit. Source: EdrawMax Online
1.1 Components of Data Flow Diagrams
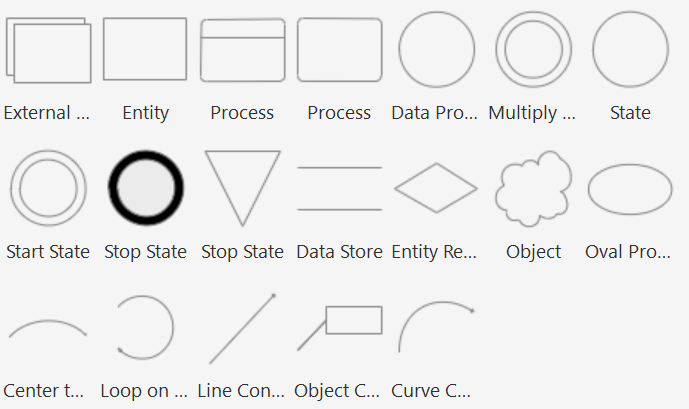
The data flow diagram shows data inputs, outputs, storage sites, and paths between each destination using predetermined symbols and shapes like rectangles, circles, and arrows, as well as short text labels. Data flow diagrams can range from simple, even hand-drawn process overviews to multi-level and in-depth that go deeper into how data is processed. The main components or symbols in the data flow diagram include:
Process
A circle is a process in data flow diagrams and depicts how the data is handled and processed in the system.
Data Flow
The data flow is the curved line that shows the flow of data in or out of the system.
Data Store
A data store denotes the storage of information that can be retrieved later or by other processes in a different order. A single element or a set of elements can be found in the data storage. The group of parallel lines denotes a location to collect the data items.
Entity
An external entity that serves as a source of system inputs or a sink of system outputs is called a source or sink.
1.2 Levels of Data Flow Diagrams
Level 0 DFDs
The level 0 data flow diagrams are the most basic, and they do not provide every little detail of the information or the structure; instead, it gives a broad view that can easily be understood. These diagrams are straightforward and show single process nodes and connections of those nodes with externalities.
Level 1 DFDs
The level 1 data flow diagrams provide more information than the Level 0 DFDs. It shows the general overview of the system. The single process node from the level 0 diagram is split into subprocesses in a level 1 data flow diagram. Additional data flows and data stores will be required as these processes are added to the diagram.
Level 2 DFDs
The level 2 data flow diagrams are way too detailed, where processes from Level 1 DFDs are further broken down into more chunks. The objective is to create a map of every little detail of the system to help the engineers to understand and work on it.
2. Data Flow Diagram Examples in Software Engineering
Data flow diagram in software engineering is a competent tool, and this tool is commonly used by many engineers when developing software and its interface.
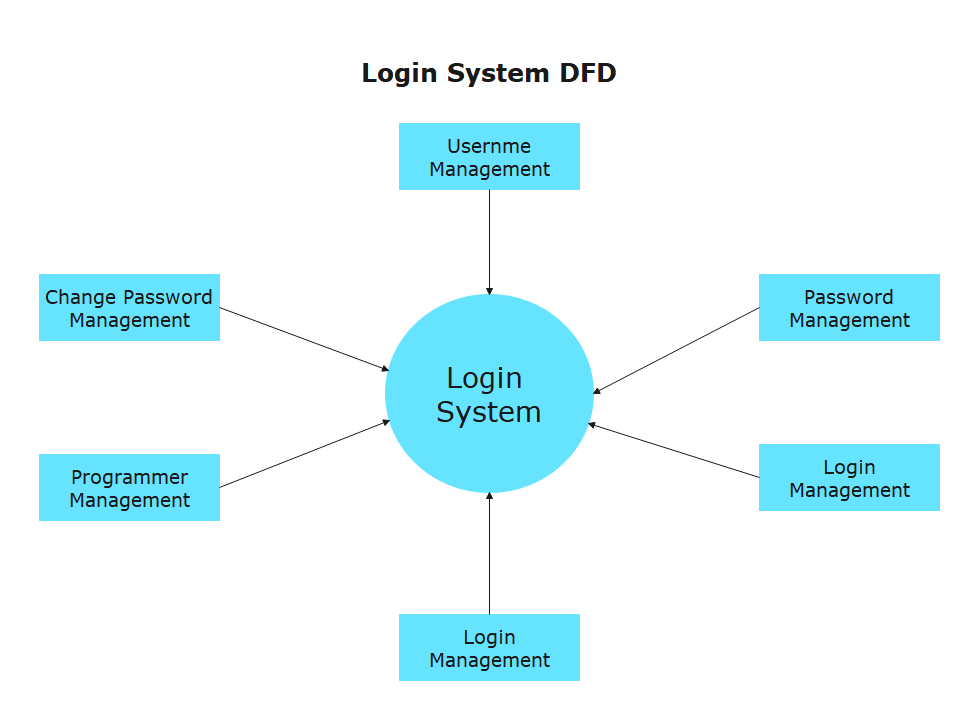
Example 1: DFD Login
In this type of data flow diagram, the whole process of the login system is picturized. It is intended to be a quick overview of password update, authentication, and login, presenting the system as a single high-level process with externalities such as username, password, and register.
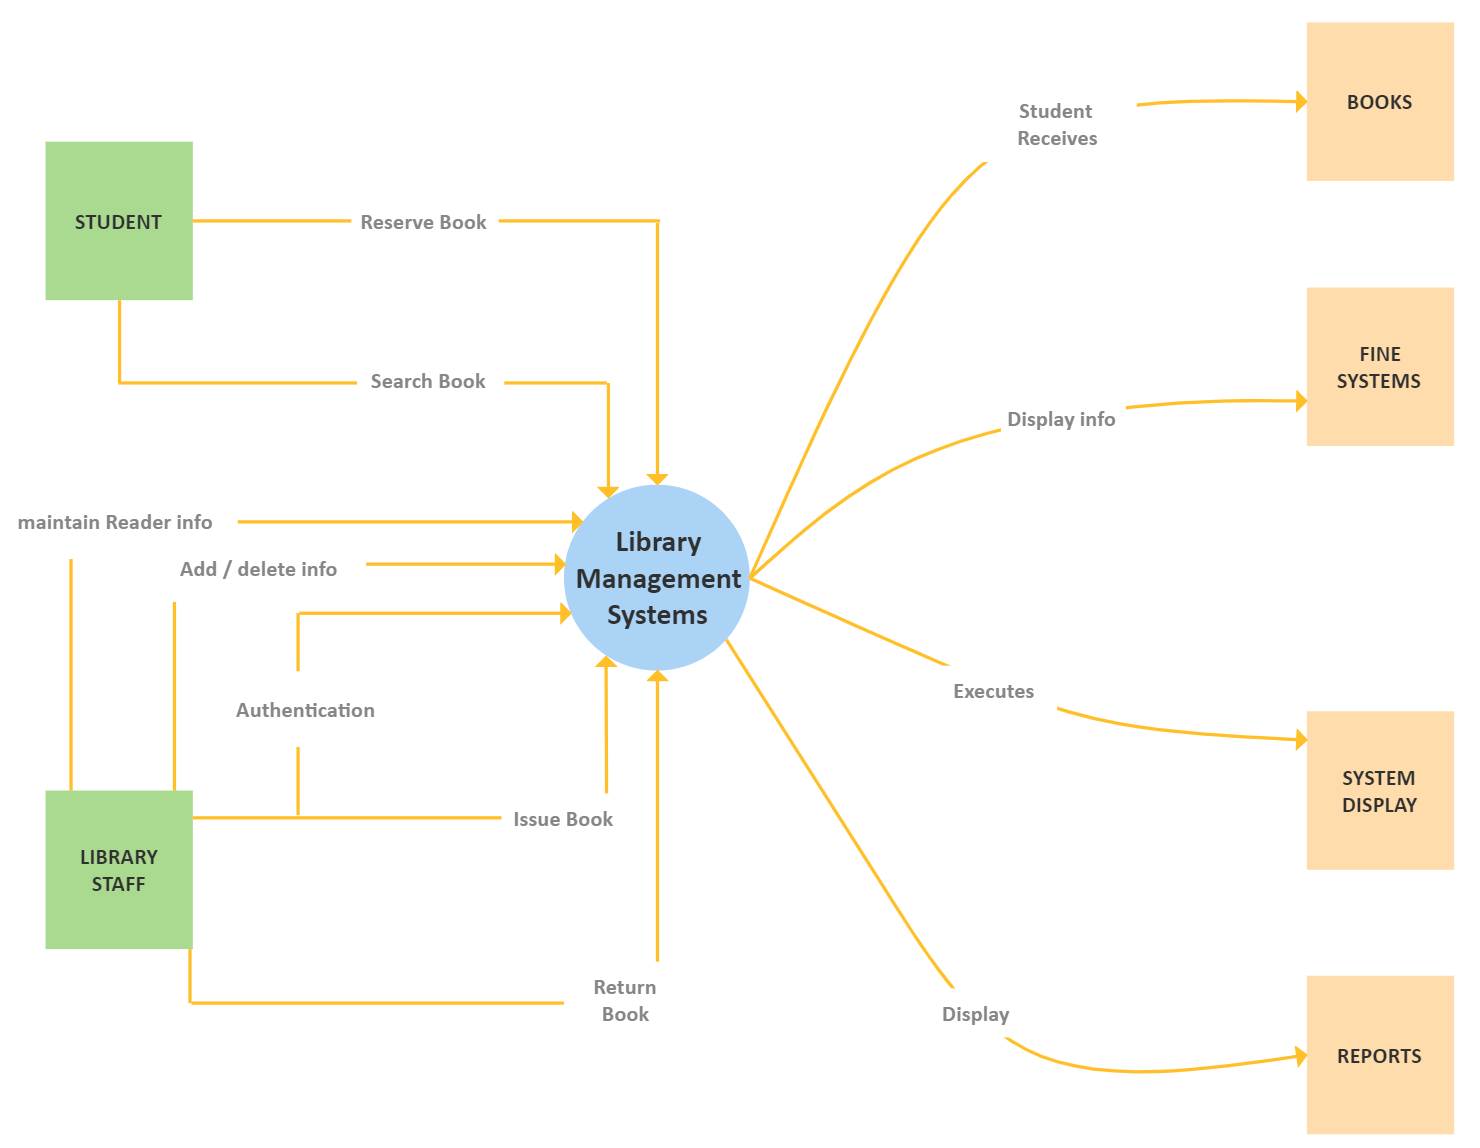
Example 2: Data Flow Diagram for Library Management System
The data flow diagram for the library management system displays more pertinent information about library employees and how they interact with the library management system internally, such as adding or removing information, authenticating students, issuing and returning books, etc. This type of diagram identifies and clarifies the software system's boundaries.
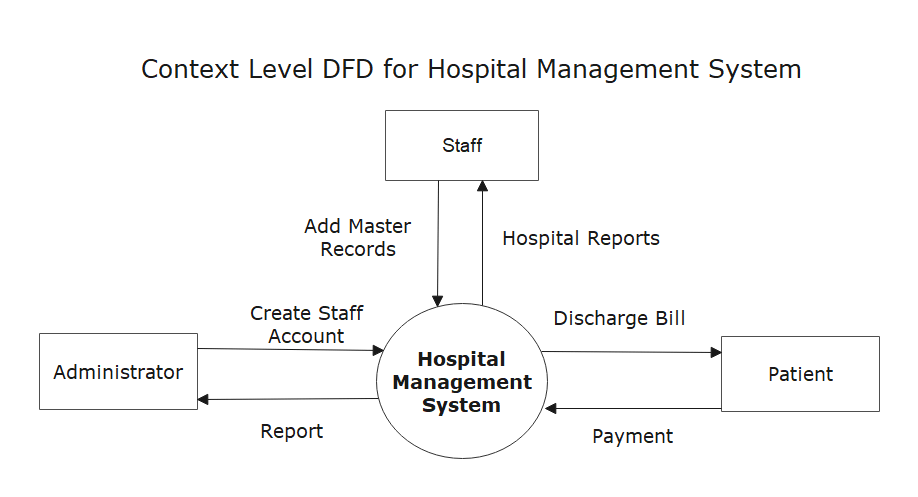
Example 3: Data Flow Diagram for Hospital Management System
The data flow diagram is a high-level overview of the hospital management system. It's intended to be a quick overview of medicine, tests, and doctor fees. It presents the system as a single high-level process with links to other entities, such as hospitals, employees, and patients. This type of DFD is understandable to many people, including hospital staff, patients, and doctors.
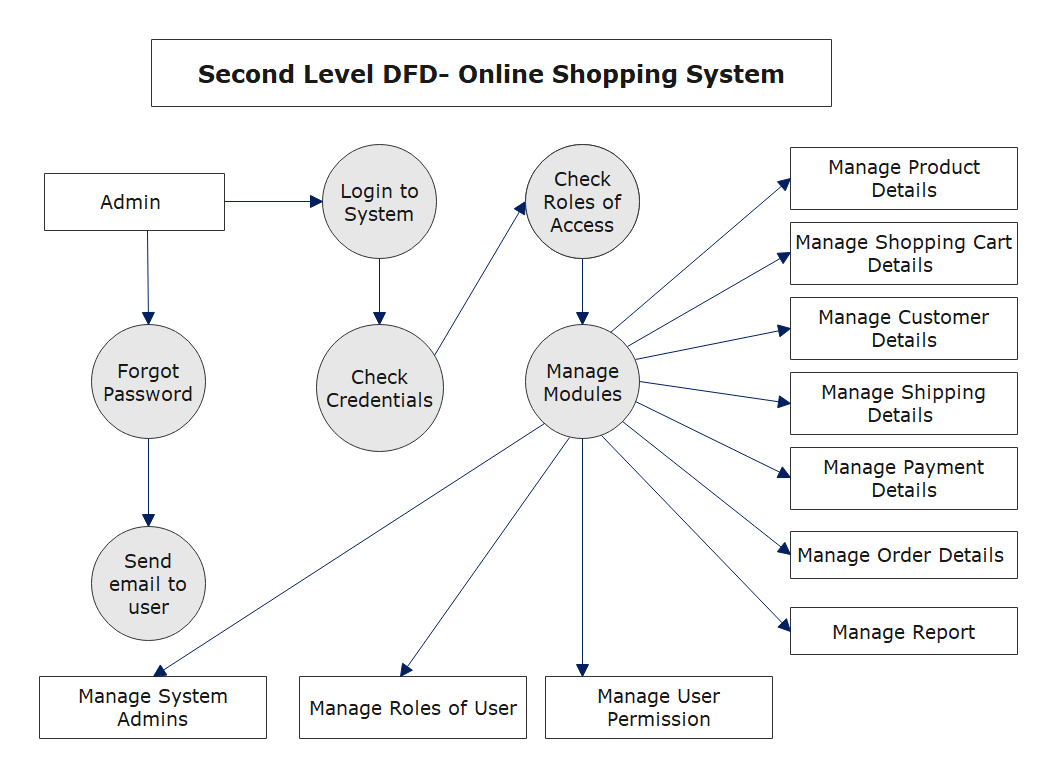
Example 4: Data Flow Diagram for Online Shopping
It is the data flow diagram where the high-level procedure of the online shopping system is presented. It's intended to provide a quick overview of product delivery and order confirmation, showing the system as a single high-level process with connections to external shopping entities. Ordering and the shopping cart should be simple enough for a wide range of people to understand, including shopping, order, and product.
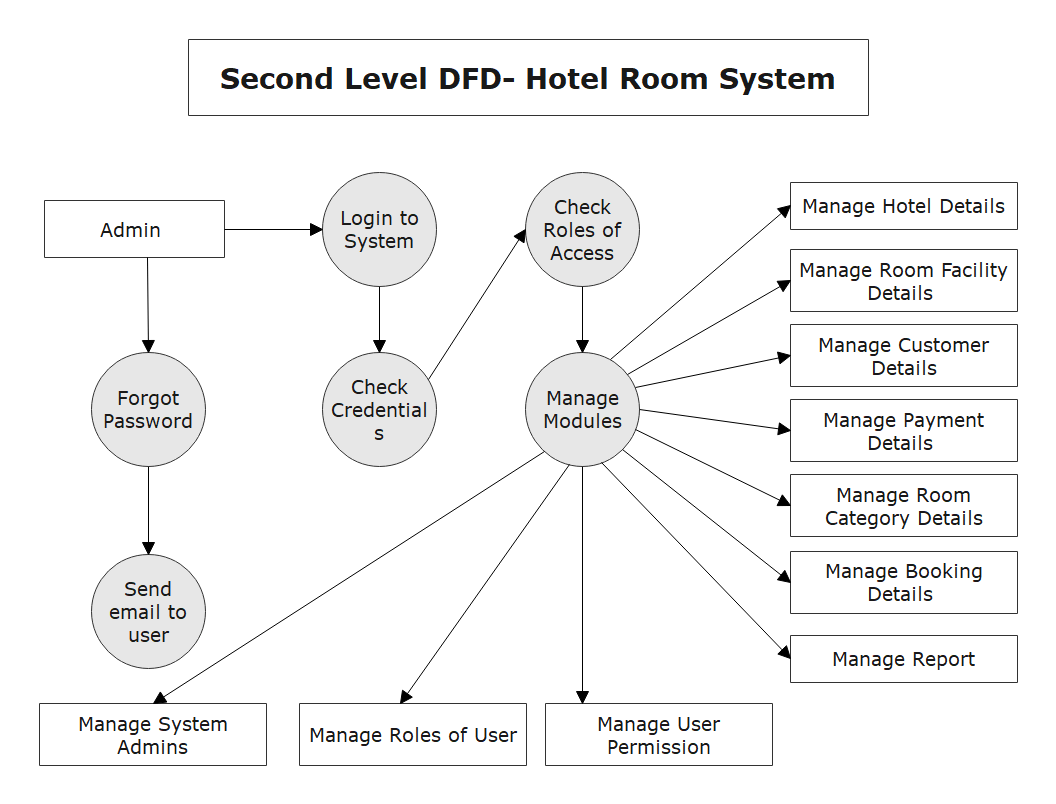
Example 5: Data Flow Diagram for Hotel Management System
The data flow diagram is a high-level overview of the hotel management system. It should be simple for a wide range of people, including hotel, room category, and payment. It's considered a quick peek at payment, customer, and hotel employee, displaying the system as a single high-level process with connections to other entities such as hotel, room facility, and room category.
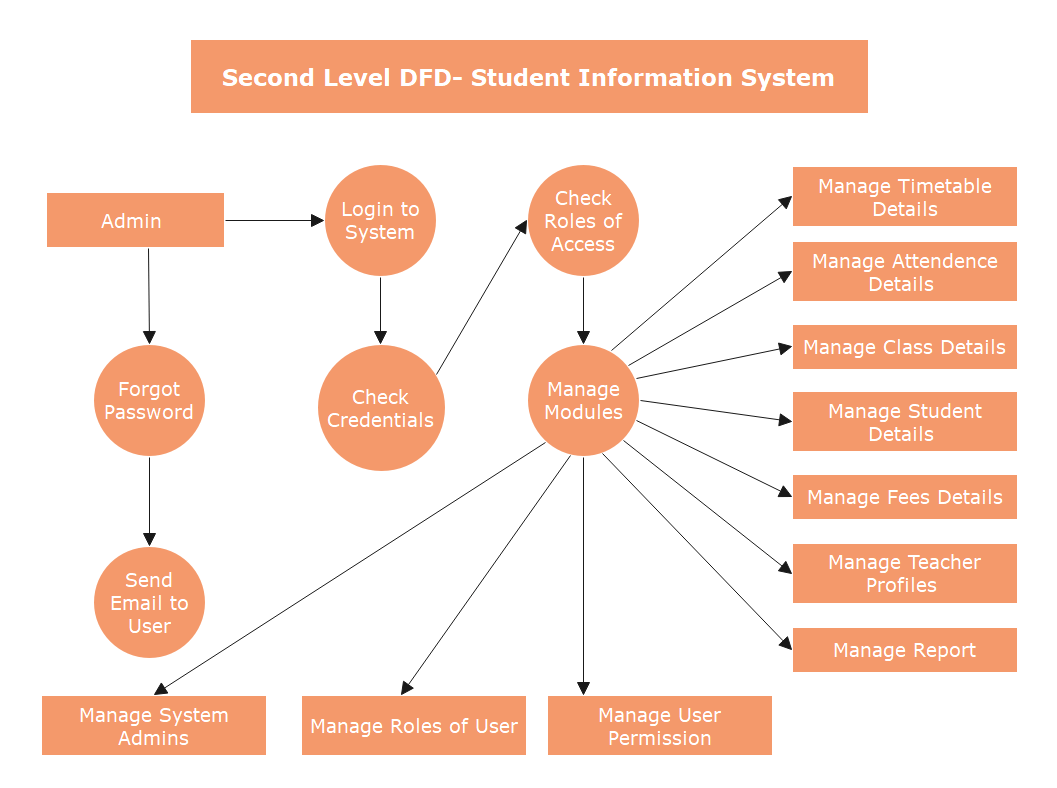
Example 6: Data Flow Diagram for Student Management System
In the data flow diagram for the student management system, the student's complete information is being analyzed. It is picturized to have an overview of faculty, courses, semester, and students showing the whole system as a single high-level process with its relationship to externalities including courses, attendance, timetable, etc.
3. Rules for Making Data Flow Diagrams
While creating a data flow diagram, there are a few thumb rules to remember
- Data can not directly flow between two entities; it must flow from entity to process and vice versa.
- Data can not directly flow between two data stores; it must flow from the data store to a process and vice versa.
- The diagram must include one input data flow and one output data flow.
- The two data flows can not cross one another.
- All the processes in the system must be linked to a minimum of one data store or any other process.
4. How to Create a Data Flow Diagram in Software Engineering?
You are already familiar with the data flow diagrams; it's time to learn to create it.
- Align your inputs and outputs; remember that each process must have an input and output.
- Start mapping out the structure by creating a level 0 DFD with a single process.
- Now increase the diagram level by adding more details like processes, data flows, and data stores.
- Label your diagram, add some shapes and lines or arrows to illustrate the whole structure, add more details where needed.
5. Online Data Flow Diagram Maker
Tired of searching for a good DFD maker? Then there is no need to worry as EdrawMax is a great tool to start working on your data flow diagrams. It is user-friendly online software that you can access on any platform to draw an effective DFD for your process. With EdrawMax, you can create more than 280 Data flow diagrams using thousands of designed elements. There are also thousands of diagram templates available that you can customize as per your engineering process needs.
It is a free cross-platform tool that you can access on any of the browsers available; using its exciting features; you can easily customize your DFDs without prior experience and give your diagrams a great look. You can collaborate with your colleagues and can export your charts in multiple formats, including PNG, PDF, VSDX, SVG, PPTX, and more. The EdrawMax also ensures your data and privacy protection.
6. Key Takeaways
The data flow diagrams are a graphical representation that is simple to understand. Software engineers use data flow diagrams to assist them in comprehending the operation and limitations of a system by visualizing content. EdrawMax is a good choice when considering an diagramming tool to make your data flow diagram. It is a free online diagramming tool with intelligent and user-friendly features for quickly creating many types of data flow diagrams.