Everything You Need To Know About Pedigree Chart
Create a Pedigree Chart Online Free Free Download Free Download Free Download Free DownloadWhat Is a Pedigree Chart?
A pedigree chart is a diagram that displays the frequency and development of phenotypes from one generation to the next of a single gene or organism and its descendants, most notably humans, show dogs, and racehorses.
Pedigree is a heritage record, which is used in human genetics to map the origin of a single trait, abnormality, or disease. A male is represented by a square or symbol, a female is represented by a circle or symbol.
Application Scenarios of Pedigree Charts
Pedigree charts can be used to determine genotypes by examining history, classify phenotypes and forecast whether a trait will be passed on in the future.
- These charts are used to evaluate the inheritance mode of a particular disease or trait, and to estimate the probability of its occurrence among offspring.
- If attempting to ascertain the existence of a recently diagnosed illness, or where a person with a family history of illness needs to know the likelihood of transmitting the disease on to their offspring, a pedigree chart can be drawn.
- Determine whether the trait is recessive or dominant. If the trait is dominant, the trait must be one of the parents'. If the phenotype is recessive, because they may be heterozygous, no parent is expected to have the phenotype.
Benefits of Using a Pedigree Chart
- A pedigree results in family knowledge being displayed in the form of a readily readable table. This can simply be called a family tree.
- Pedigrees use a generic series of symbols, squares represent males and circles represent females. Pedigree creation is a family history, and as memories disappear, information from an earlier generation may be unclear.
- Relationships are seen as a sequence of lines within a pedigree. A horizontal line binds parents, and a vertical line continues to the offspring.
Pedigree Chart Symbols
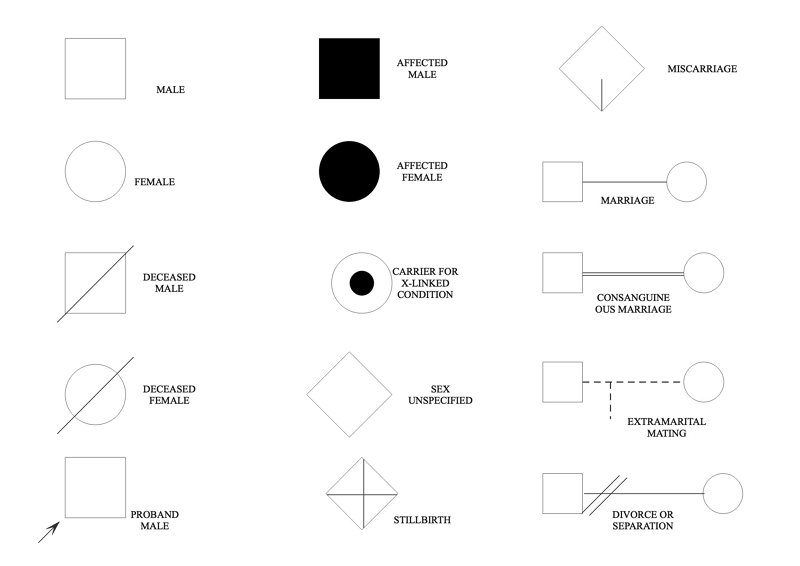
- Pedigree charts are plotted using regular symbols and format.
- Males are depicted by squares and females are represented by a circle.
- People that are dead are represented by a diagonal line across the symbol.
- Symbols are shaded when people are affected by a given condition.
- Carriers in the centre of a symbol may be represented by a half-shaded symbol or by a circle.
- A proband is marked by an arrow pointing to the individual's symbol.
How To Read a Pedigree Chart?
First of all, determine whether the condition is recessive or dominant. If the trait is dominant, the trait must be one of the parents'. If the phenotype is recessive, because they may be heterozygous, no parent is expected to have the phenotype.
Then, determine whether an autosomal or sex-linked (usually X-linked) trait appears on the chart. For example, males are often more frequently affected than females in the X-linked recessive traits.
6 Types of Genetic Disorder
- Y-linked disorder
- Mitochondrial disorders
- Autosomal recessive disorder
- Autosomal dominant disorders
- X-linked recessive disorder
- X-linked dominant disorder
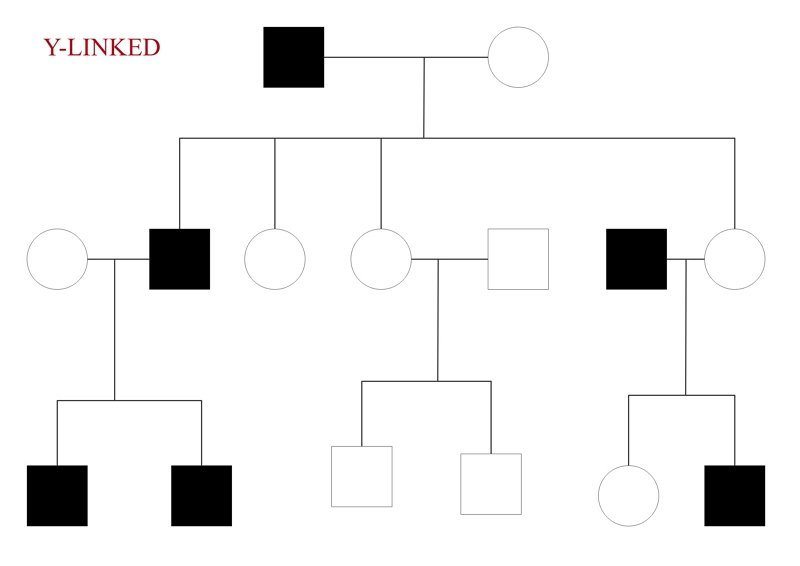
Men can get involved in a Y-linked disorder. When the father is affected all the sons are impacted. It won't miss a generation, either.
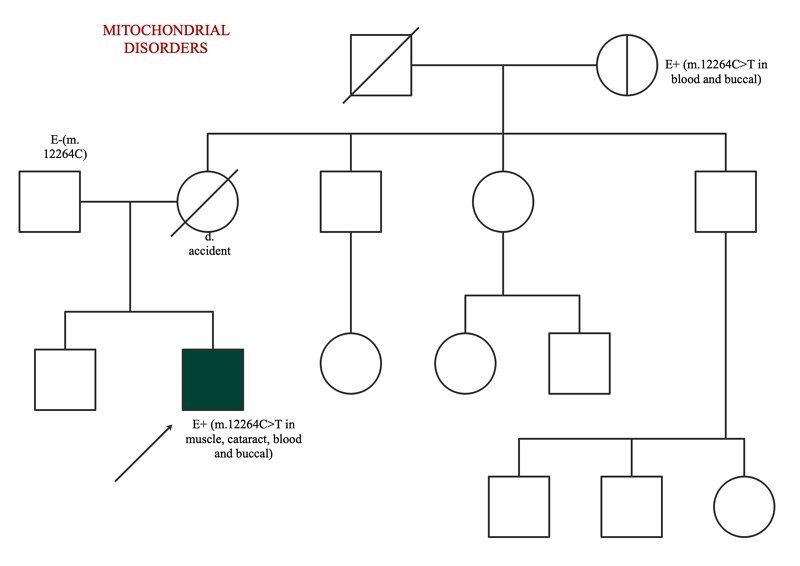
For mitochondrial diseases, it is passed on only if it affects the mother. If the mother is infected it affects all offspring. He doesn't transfer that down to his children if the father's impacted.
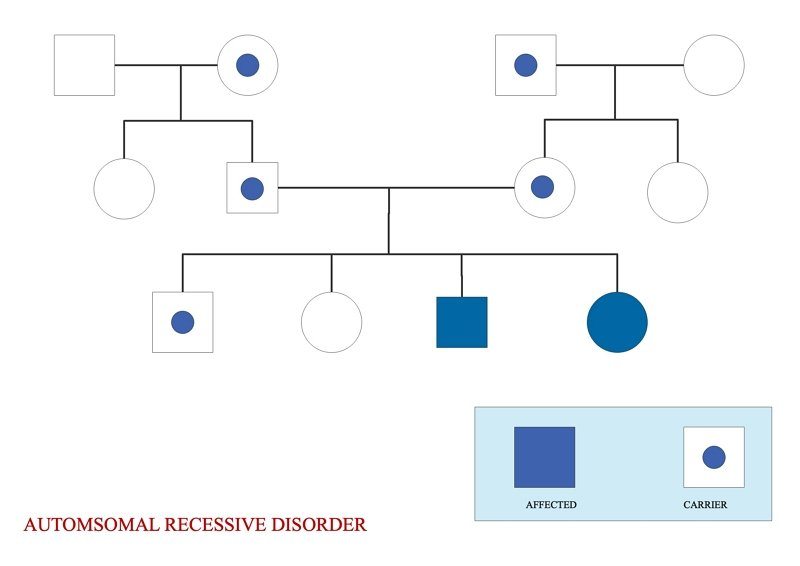
Both parents don't express the trait in an autosomal recessive disorder, however, because both are carriers, their children will express the trait.
Usually, autosomal recessive diseases miss a generation, and usually, affected children have unaffected parents. All males and females are more likely to be diagnosed by an autosomal recessive disease.
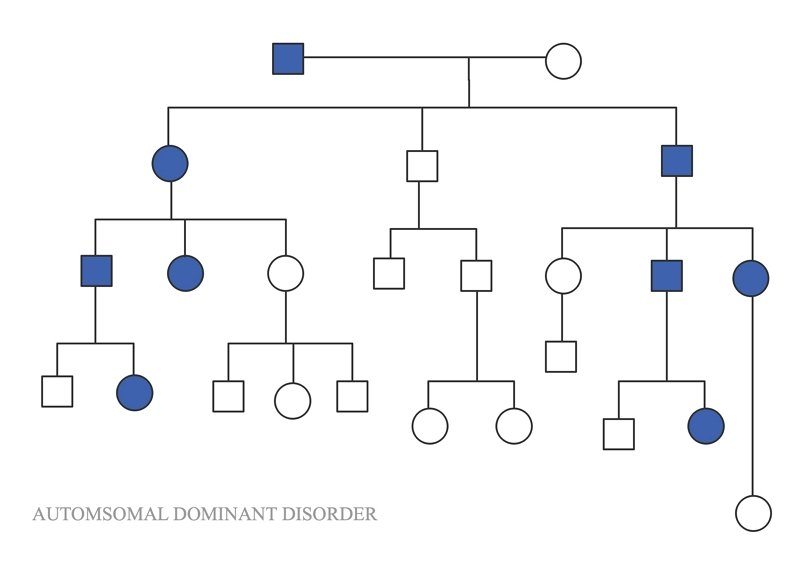
Autosomal dominant conditions do not miss a generation, so children have been affected by the infected parent. One parent may have the condition to influence his offspring.
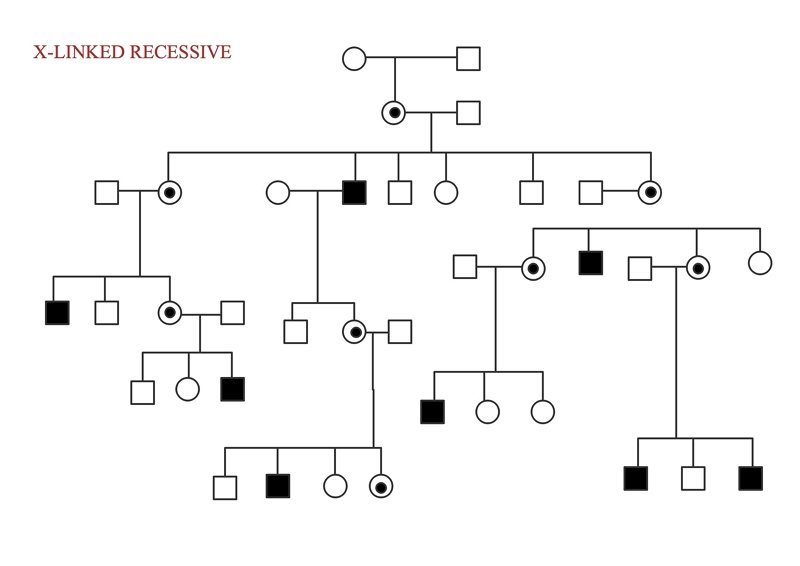
Females are more likely to be affected than males with an X-linked recessive disease. Usually, affected sons have unaffected mothers. For the daughter to be affected the father must also be affected and the mother must be affected.
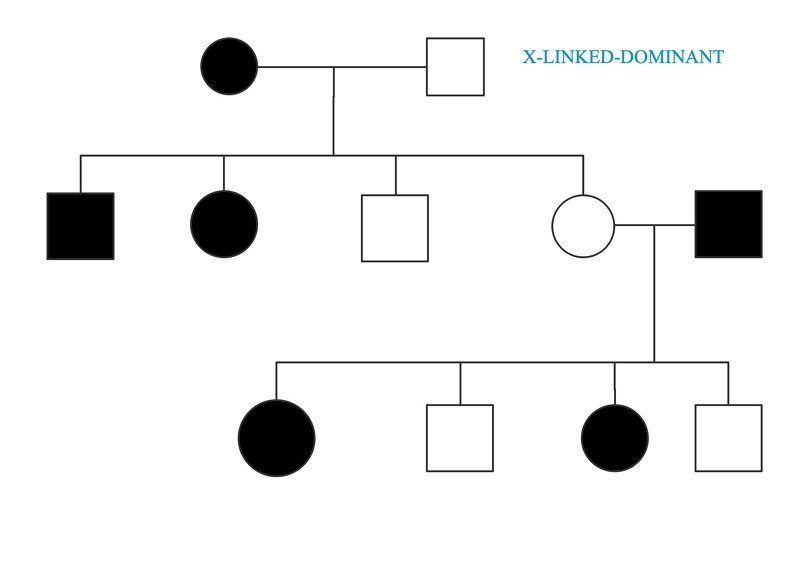
In X-linked dominant disorder, is where all daughters are affected by the father and no sons are affected. It does not skip a generation and if the mother is affected she has a 50% chance of passing it onto her offspring.
Common Mistakes and Misconceptions of Pedigree Charts
A common misconception is that the involvement of multiple individuals affected within a family does not necessarily mean that the trait is dominant. The dominant and recessive words refer to the way in which a trait is displayed, not how often it occurs within a population.
You will not often be able to determine an individual's genotype based on a pedigree chart. For a trait, a person can often be either homozygous dominant or heterozygous. Also, in evaluating genotypes, we will use the relationships between a person and their mother, relatives, and offspring.
Key Takeaways
A pedigree chart helps represent a map of a family's ancestral heritage over several generations. It helps in identifying dominant and recessive genes and the effect it has on the child. This helps map hereditary genes and acquired traits.
This may be used with a trait such as having a widow's peak or attached earlobes, or an inherited disorder such as colourblindness. EdrawMax’s easy to use interface helps you design pedigree chart with just a few clicks.


