Affinity Diagram: A Simple Guide To Organize Ideas
Create a Affinity Diagram Online Free Free Download Free Download Free Download Free Download1. What Is an Affinity Diagram?
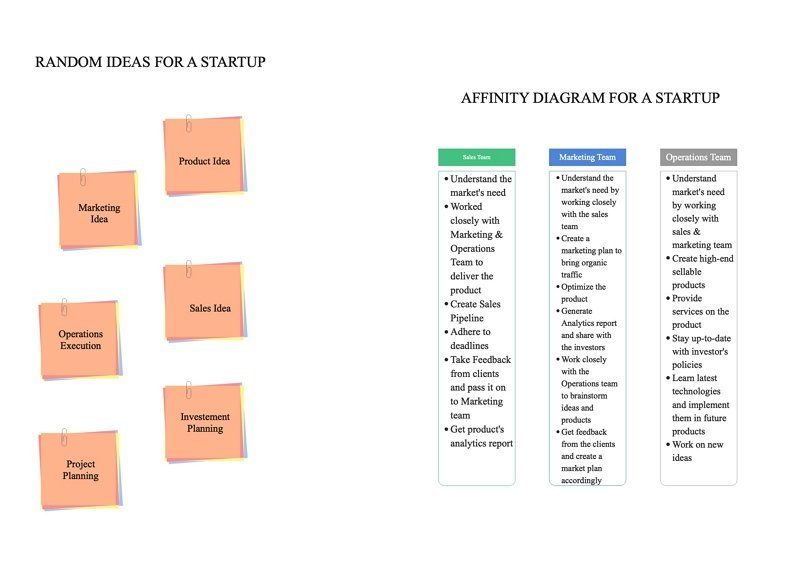
A comparison between random ideas and affinity diagram.
An affinity diagram is a tool that is used to organize data and ideas. Affinity diagrams help you arrange information by separating contextual evidence or findings into classes of related objects. What’s more, an affinity diagram is a technique that captures and organizes vast volumes of language data (ideas, thoughts, issues) into groupings based on their relationships.
2. Situations To Use an Affinity Diagram
In general, affinity diagrams are used when one has to organise a large number of ideas into their natural relationships. In order to maximize the productivity and efficiency, several business and design teams uses this as it presents the organised output from a brainstormed session. Moreover, Affinity Diagrams can help you transition from complete confusion with no relevant information in sight to building an information classes that you have identified.
- Use Affinity Diagram where you are in utter confusion faced with multiple facts or ideas.
- Use Affinity Diagrams when the presented problems are too broad or complicated to comprehend.
- Affinity Diagrams are used when consensus is required in a large group.
- When people are brainstorming ideas, these diagrams comes pretty handy.
- When you need to gain knowledge of any relevant industry and create a structured flow of information.
3. Benefits of Using Affinity Diagrams
Apart from creating a perfect environment for all the team members, affinity diagram has several major benefits, like:
- It clarifies and generate ideas speedily that allows time for discussing on the important nodes.
- It builds confidence in the team members as it ensures equal participation from everyone involved with the project.
- It helps understanding the right working order and helps in building a consensus within the team.
- It also enable the identification of associations between theories or ideas to unify large amounts of data.
4. How To Make an Affinity Diagram?
Affinity diagrams can be created by using the options of different people from the business cycle and sum up it to to make it more relevant that can be accessed in future for a better understanding. There is a simple five steps approach for this model.
- Step 1: Brainstorm ideas and document all of them
- Step 2: Search for similar trends and statements or findings
- Step 3: Create a category for each theme or pattern
- Step 4: Give a name to each style, or category
- Step 5: Draw the finished affinity diagram with EdrawMax
To generate ideas for making an affinity diagram, brainstorming uses a combination of traditional brainstorming and the Crawford slip approach. Individuals generate ideas in traditional brainstorming that they voice in turn.
Every member inside the community offers suggestions until no one has anything further to say. Ideas are captured in silence on index cards, paper clips, or sticky notes, in the Crawford slip process. There is no exchange of words. Brainstorming uses a combination of those two methods for the affinity diagram.
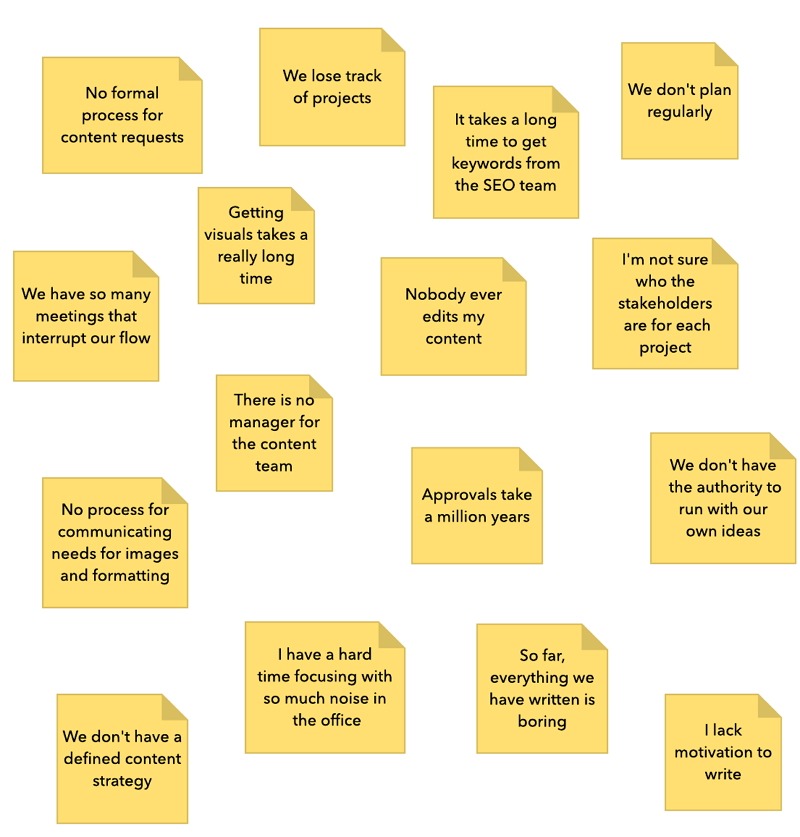
Look at all the ideas from the print storming session and group them into similar patterns that will emerge. This will help you to group similar ideas into clusters and help organise them effectively.
This can be done by looking at the ideas and finding similar patterns or trends. Once you identify these patterns you can group them together.
After grouping, these ideas are laid out in a similar pattern or theme. The next step is to categorise them on the basis of their theme.
For example, ideas on how to improve customer service can be grouped into one category whereas ideas for products development can be another category.
Assign all ideas into specific groups with header names. This is an important step because it helps give a structure to your brainstorming process and organise the ideas on the basis of subsections and categories.
The last step is to draw the finish affinity diagram based on the above-given steps. This helps you to visually illustrate your ideas and processes and act as an analysis for them. It can be done manually however it is suggested to use EdrawMax - a diagramming software to draw your finished diagram.
5. How To Make Affinity Diagram Online?
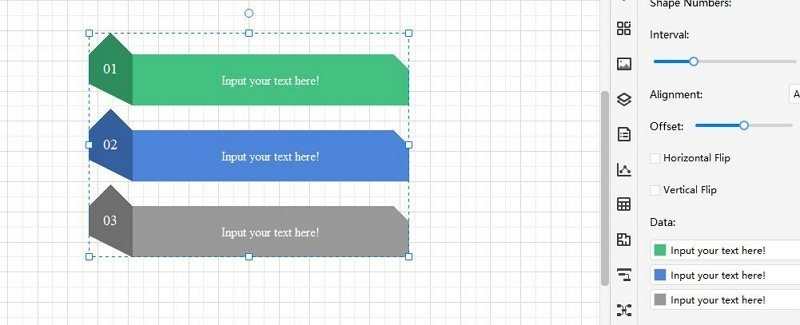
EdrawMax is a fantastic tool to help create these diagrams. It has smart floating action buttons and handles, that help you change item numbers and shape size easily at will. It is also user-friendly and easy to use. You can make an affinity diagram easily by following these steps.
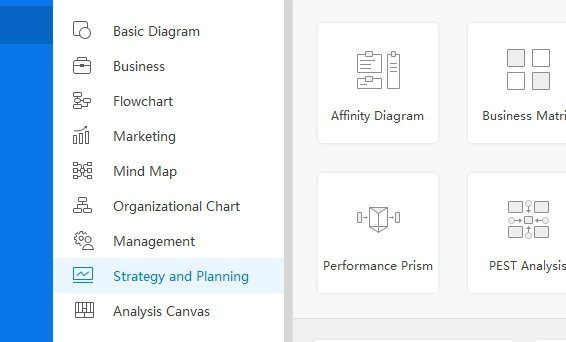
- Step 1 - Open EdrawMax and select ‘Strategy and Planning’.
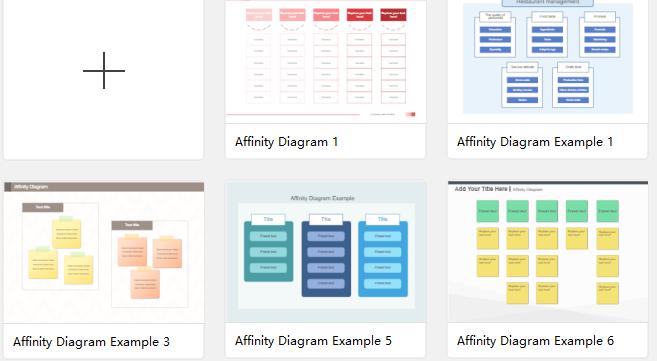
- Step 2 - Under ‘Strategy and Planning’ Click on Affinity Diagram and you can either use a template or select a blank canvas.
- Step 3 - Once selected, your page will open and you can create the diagram.
- Step 4 - Use EdrawMax’s wide range of shapes and add your text in the diagram.
- Step 5 - As EdrawMax is compatible with multiple file types one can save and export the diagram to any file type they wish to, for example JPEG, PDG, Portable Bitmaps, Word Format, Excel Format, and PowerPoint Format among others.
6. Affinity Diagram Examples
This diagram depicts an affinity diagram for a food delivery system. And it includes various headers with ideas under them to organise the flow of ideas.
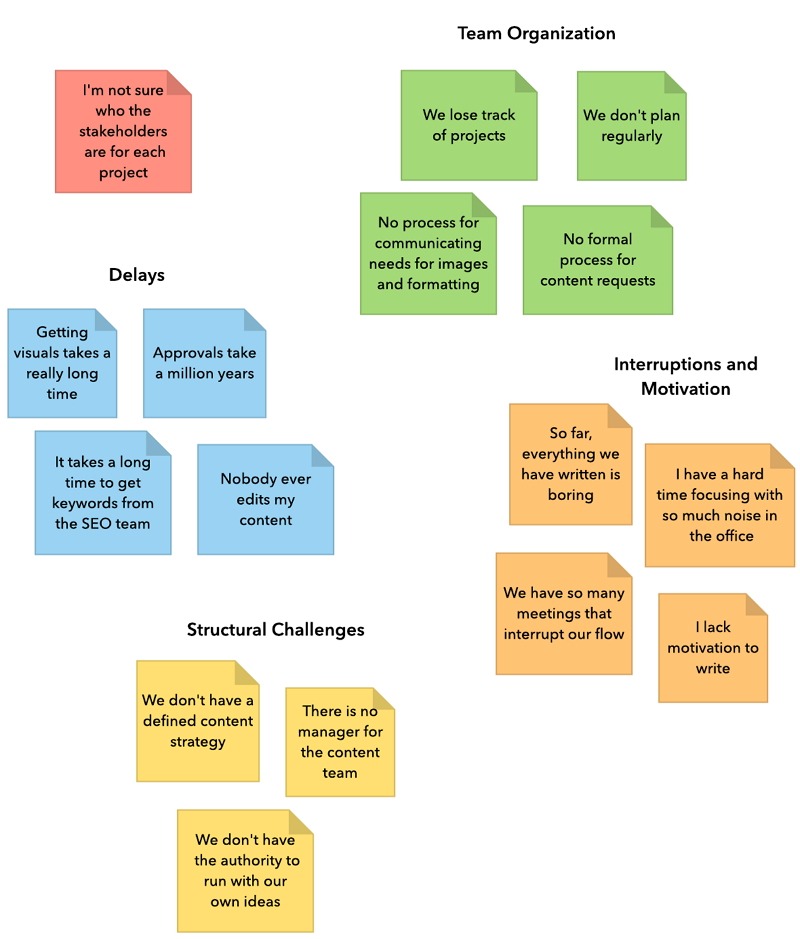
This is an example of common problems faced by new business ventures. They are divided into four categories making it easier to fix them.
7. Tips for Drawing Affinity Diagrams
There are a few things that one should keep in mind as and when they make their very first affinity diagram to resolve a problem:
- As mentioned, Affinity Diagram has several participants. So, the mapping would be optimised if one limit the participants to five or six.
- Affinity Diagram works best if there are more than 15 data points, so your project should have these many points.
- Creation of Affinity Diagrams is all about grouping but one should not overdo it as it will create several challenges in the long run.
8. Key Takeaways
Affinity diagrams can help you bundle and cluster vast volumes of information, facts, ethnographic research material, design questions, and other knowledge base that needs to be accessed on later stages. As mentioned in detail, if any business body follows the step-by-step methods on EdrawMax and straightforwardly create an overview approach that will allow them to appreciate the relationships between several group of presented information.


