A Guide To Understand Growth Share Matrix
The BCG growth share matrix helps companies plan their products in long term. This method helps companies determine which goods warrant discontinuation, production or further investment. This article introduces what is growth share matrix, and its 4 components, as well as how to make it in EdrawMax.
1. What is The Growth Share Matrix?
The growth share matrix of the Boston Consulting Group ( BCG) is a planning technique that uses graphical representations of the goods and services of a business in an attempt to help the organization determine whether hold products, sell products, or invest in new market.
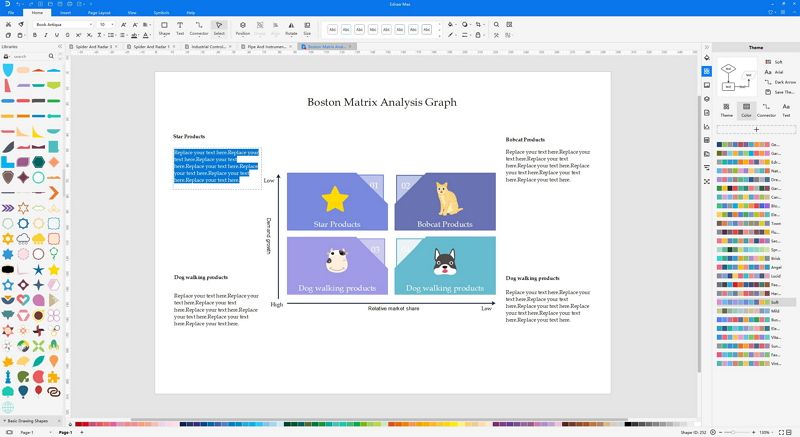
This growth share matrix shows the products of a company in a four-square matrix, with the y-axis indicating business growth levels and the x-axis indicating market share. This method helps the company allocate resources, and is used in brand marketing, product management, strategic management and portfolio analysis as an analytical tool. It is important today in strategic business planning and educating business schools.
1.1 The Components of Growth Share Matrix
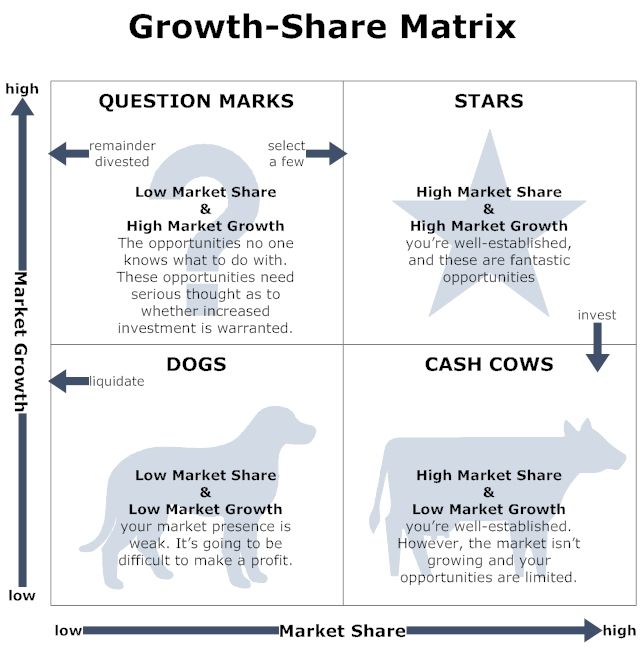
The BCG matrix matches products into four different types of categories. The placement is based on growth in the market and a market share. Every product falls into another quadrant, helping the company determine whether to manage specific goods.
Source: Pinterest
- Dog
- Question Mark
- Star
- Cash Cow
Dog is the small-growth goods with poor market share. Usually, these materials are called waste. Money gets attached to these products, but they don't make enough profit to justify the investment.
It can turn out that dog is cash trap, locking up company funds for lengthy stretches. It is the prime candidates for liquidation for that reason.
Dog is the unit in a mature, slow-growing sector with limited market share. Such unit usually "break-even," producing barely adequate cash to hold a market share of the sector, and suppressing the return on assets ratio of a profitable corporation.
Question mark is also known as the ‘problem child,’ and represents the products containing low market shares in a high growth market. These items are called question marks since the way they work is ambiguous.
Question mark is in the grid's upper right side. It usually grows rapidly but requires vast quantities of capital from the organization. Items in this quadrant should be examined regularly and carefully to see if they are worth to upkeep.
Question Mark has the ability to capture market share and becomes star, and potentially becomes cash cow as consumer growth slows. On the contrary, question mark may often not excel in becoming a market leader even after significant sums of investments, thereby ultimately transforming into dog.
Goods in high-growth sectors that represent a large portion of the market are called "stars" and can be invested in more. In fast-growth markets, goods which are Stars have a large market share. These goods possess the potential of being industry leaders. They have the potential to eventually become cash cows.
Not all stars turn out to be cash cows. This is particularly important in fast-changing markets, where modern, groundbreaking goods will quickly be outcompeted by modern technical innovations, and instead of being a cash cow, a star may become a dog.
Cash Cow represents the goods in the low-growth market with a high market share. Those are products which drive your company revenue. Goods in low-growth markets but with which the company has a fairly strong market share are called "cash cows," and so the company will milk the cash cow as long as possible.
Companies are encouraged to spend in cash cows to sustain existing production levels, or to actively "milk" the profits. To help their continued production, the cash earned from cows should be invested in stars and question mark quadrants, thus assisting the cash cows in retaining their existing market share.
1.2 The Pros and Cons of Matrix Diagram
Advantages of the Growth Share Matrix:
- Realistically easy to perform. This growth-share matrix is a simple classification system for any company;
- Helps to understand portfolio strategic positions and evaluate current existing strategies and their effectiveness;
- This is a good starting point to explore more in-depth analysis.
Disadvantages of the Growth Share Matrix:
- Study of growth-share has been widely criticized for its oversimplification and lack of practical execution;
- Only four quadrants can be classified for the business. Classification of something that falls right into the middle can be misleading;
- May not consider any potential variables which may fully alter the situation;
- Market share and growth rate in the industry are not the only factors or measures of profitability. However, high market share does not automatically mean high earnings;
- This disputes that there are synergies between the different quadrants. Dogs can be as valuable to companies as cash cows as it helps gain strategic advantage for the rest of the business.
2. How to Create A Growth Share Matrix in EdrawMax
Step 1: Open EdrawMax, then click ‘Marketing’, choose the ‘Matrix Diagram’ in upper navigation panel.
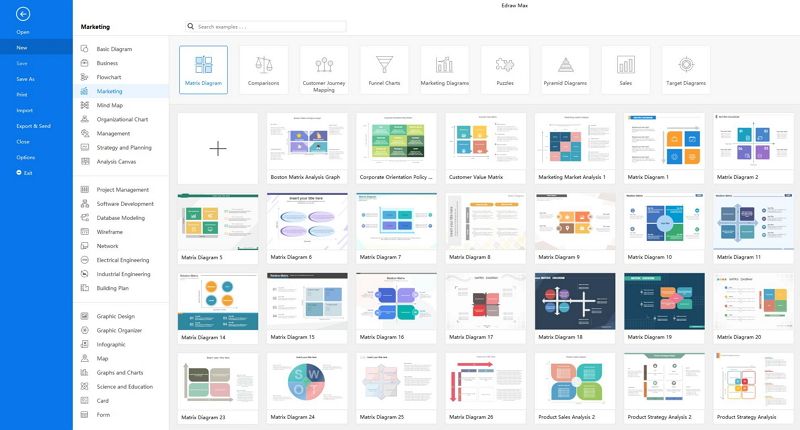
Step 2: Once selected, you can choose a template or the option for a blank canvas.
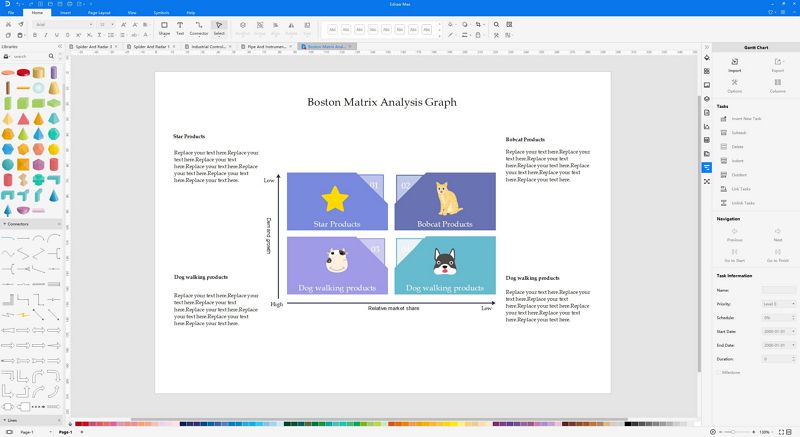
Step 3: Create your growth-share matrix, from a wide range of shapes, colors, and symbols in libraries.
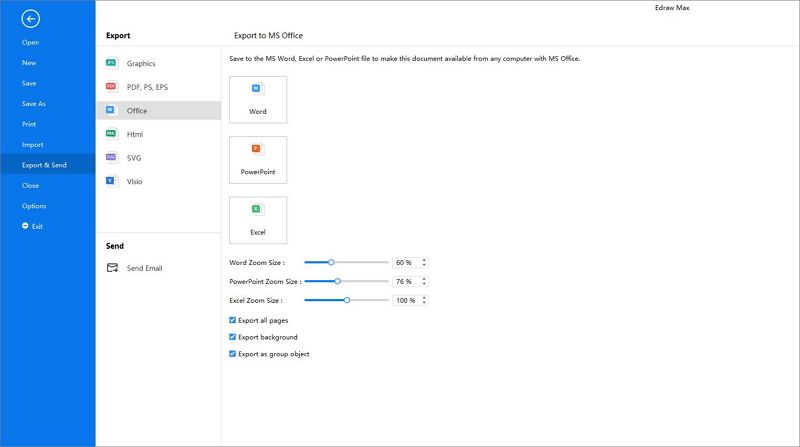
Step 4: Save and export your diagram to any file type you wish to, as EdrawMax is compatible with multiple file types.
3. Example of The Growth Share Matrix
There is a growth share matrix example shows what is the Apple inc. marketing strategy in the following.
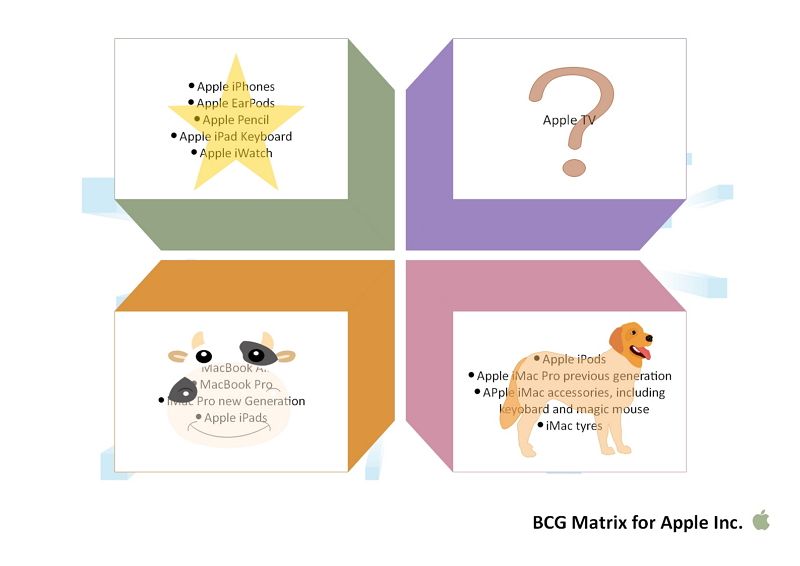
The above example is the growth-share matrix of Apple Inc. The stars for Apple are its products - iPhones, Earpods, Apple Pencil, Apple iPad Keyboard, and Apple iWatch. In the question mark quadrant, there is Apple TV, the future of this product will determine which quadrant it will shift to.
MacBook Air and Pro, iMac Pro, and Apple iPads are the cash cow quadrants. And iMac tyres, Apple iPods, Apple iMac accessories all fall into the dog quadrant and the company requires to take a closer look at these products.
4. Conclusion
The growth share matrix is the method for companies to make decisions on allocating capital and resources. The matrix is a decision-making tool, so it doesn't actually take all the considerations a company eventually needs to take into account. Growing market share, for example, could be more costly than increased revenue income from new revenues.
EdrawMax has the option of various templates and illustrations available to allow you to quickly create a diagram and save valuable time. All shapes and clipart are vector format design, which means your growth share matrix will never get blurred, irrespective of what size you change it to.


