How to create spider charts/radar charts in Google Sheets
Create a spider chart Online Free Free Download Free Download Free Download Free DownloadWhat Is a Spider Chart?
Spider charts, or radar charts, are a handy graph to use when you need to perform a multivariable comparison or analysis. It is best used when there are multiple variables and corresponding data points. You plot the data points clockwise and join the points with grid lines to create a polygon. Comparisons between multiple groups can be made by overlapping the polygons over each other.
So what are some of the benefits of using spider charts?
- It allows for quick, visual presentation of data.
- Facilitates analysis of data.
- You are able to compare a large range of variables against each other.
- Anomalies or outliers can be quickly identified.
Unsurprisingly, spider charts are commonly used in the business world. Typically, they are used to review an individual’s performance or compare the quality of multiple products. It is a quick, visual way to spot the strengths and weaknesses of whatever variables are in question.
Video Tutorial: How To Create Spider Charts in Google Sheets?
Follow these steps to create a spider chart in Google Sheets. Note that you must have an account with Google to do this.
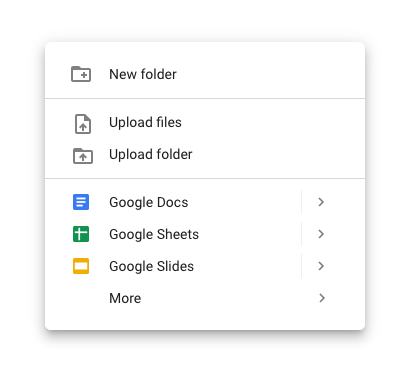
- Open a Google Sheets document in your Google Drive by right-clicking in the main menu and selecting “Google Sheets”.
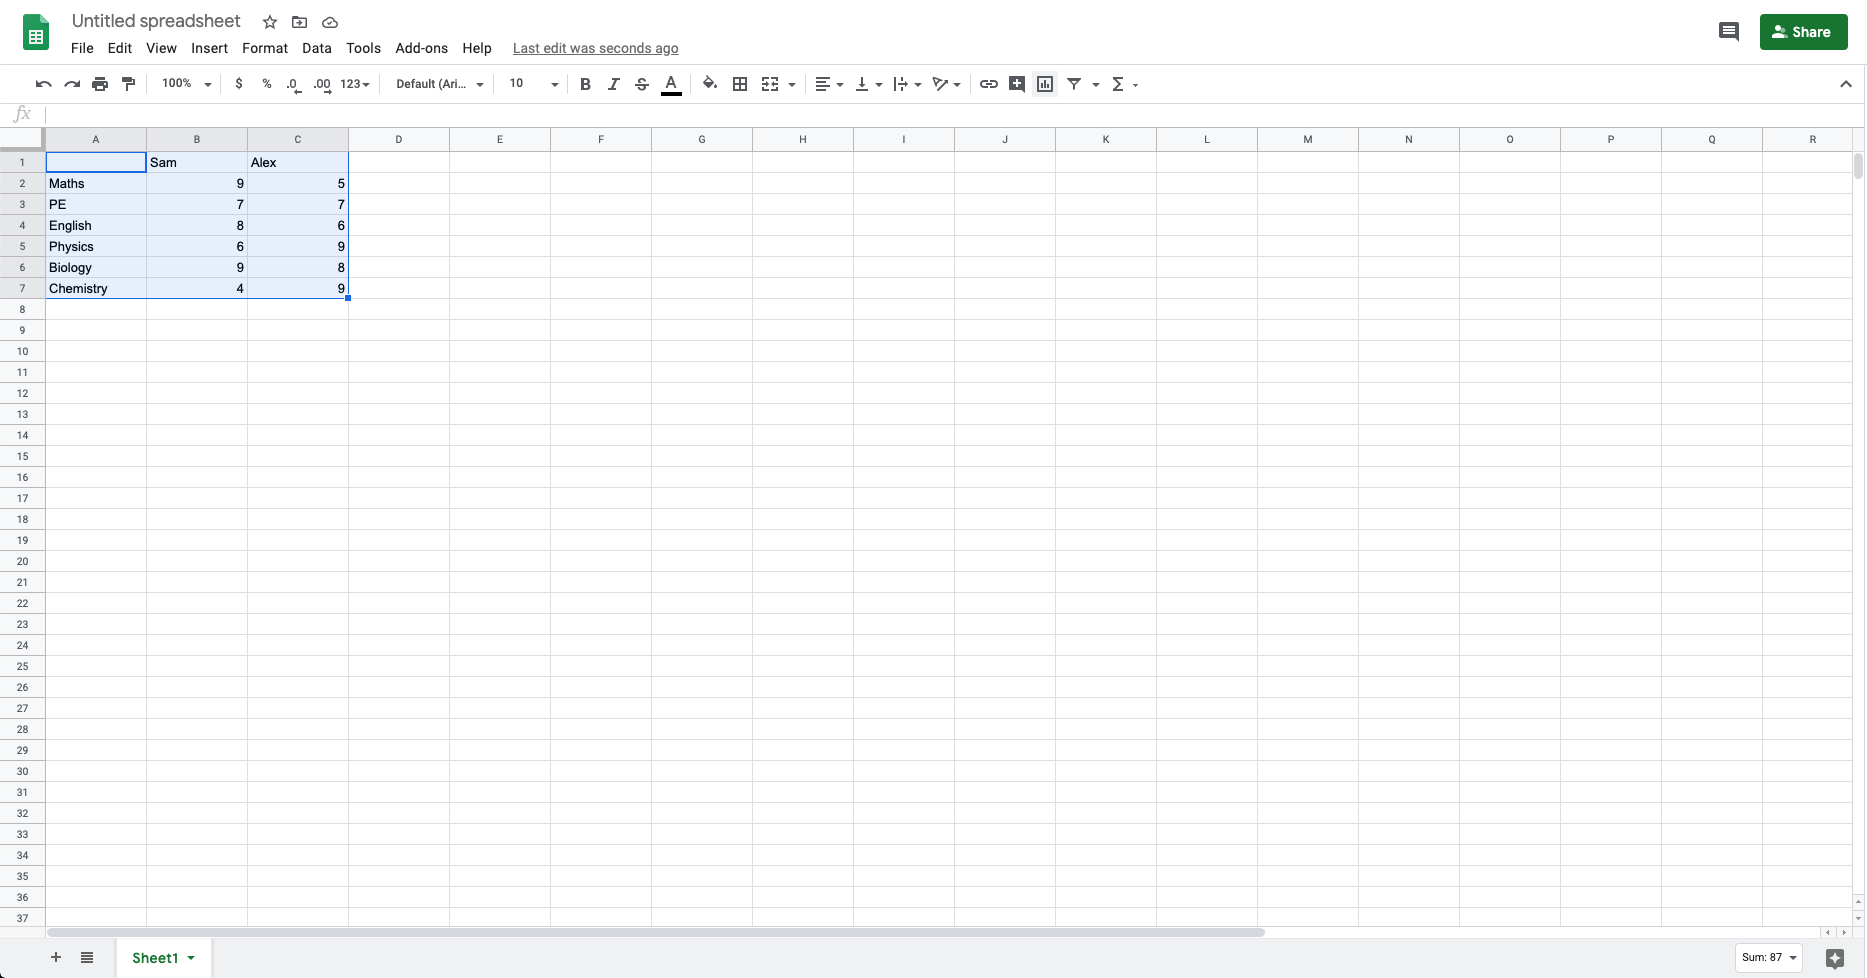
- Enter the variables and data into the Google Sheet.
- Select all of the data with your cursor, and then select the “Insert Chart” icon on the toolbar.
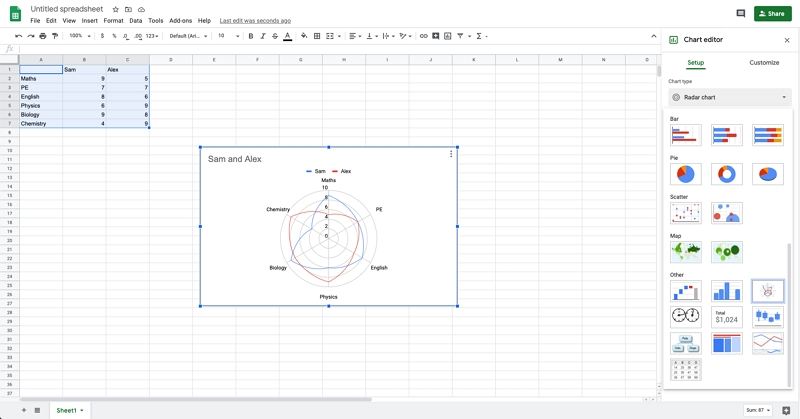
- In the Chart editor → Setup → Chart type drop-down menu, scroll down and select Radar Chart.
- You have created your spider chart/radar chart. In Chart editor → Customize, you may change the presentation of the chart to fit your liking.

To see everything all together, here is a video tutorial on creating a spider chart/radar chart on Google Sheets.
Video Tutorial: How To Create Spider Charts in EdrawMax?
In EdrawMax, there are two quick and easy ways to create a spider chart. Visit the online version of EdrawMax, or download the desktop version here, and follow these simple steps.
- Open a new document by clicking on New → the big “+” icon.
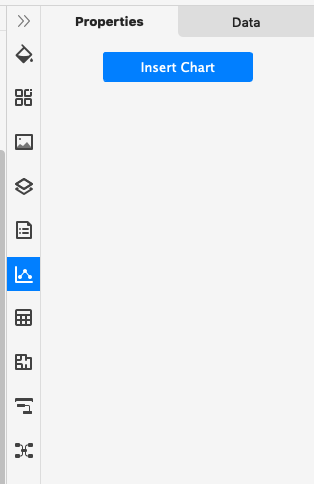
- On the right toolbar, click on Chart → Properties → Insert Chart.
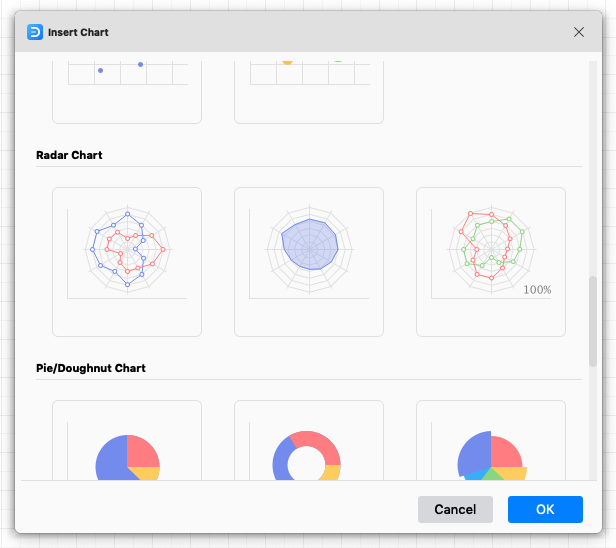
- Scroll down and select a radar chart, then click “ok”.
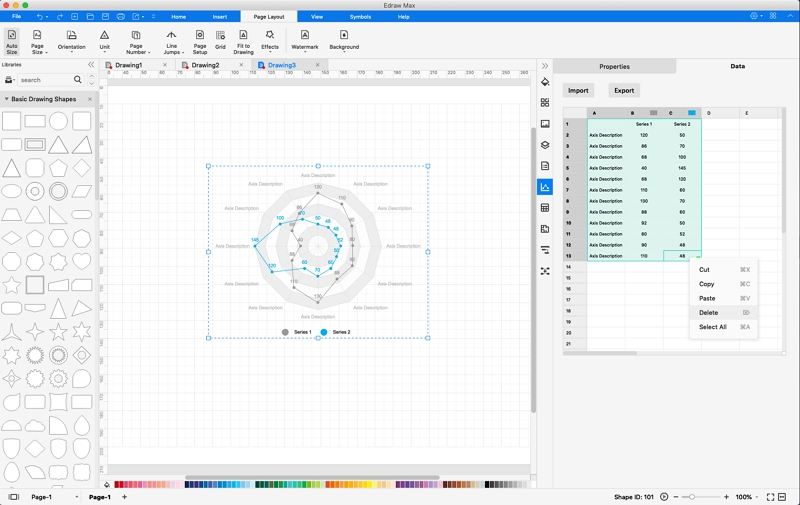
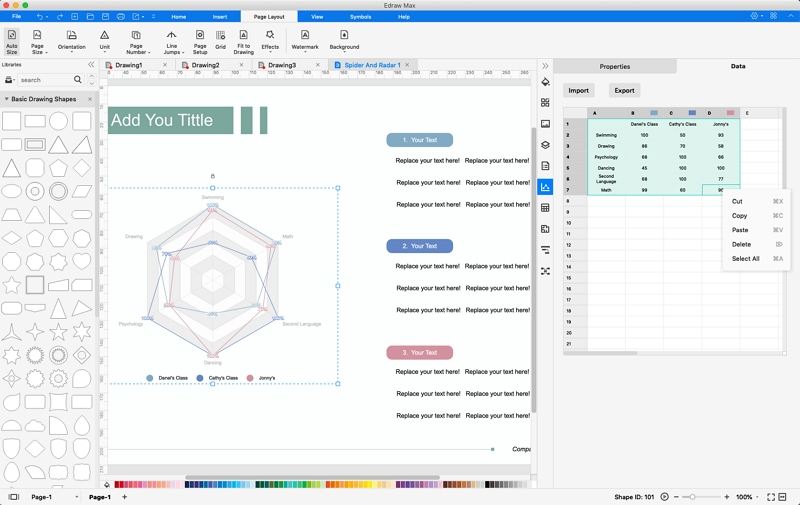
- On the right toolbar, click on Chart → Data. Select all of the default data, right-click, and click Delete to clear the data. This will allow you to input your own data.
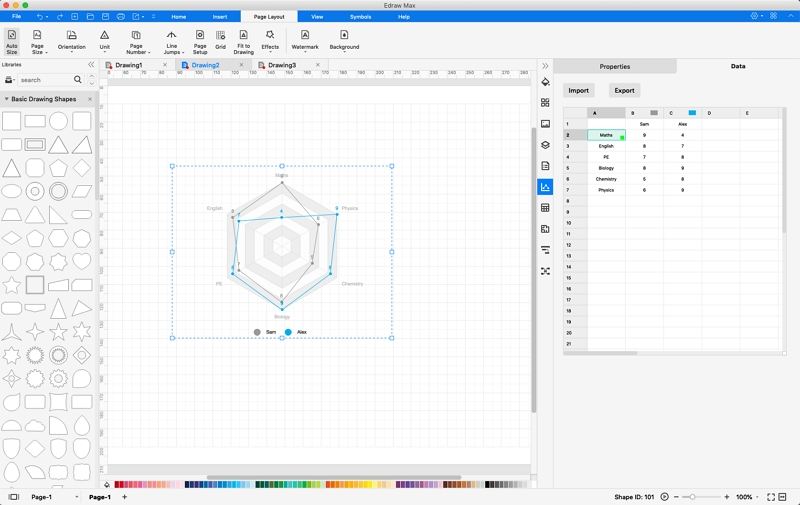
- Simply input your own data, and the spider chart will be automatically created.
To see everything all together, here is a video tutorial on creating a spider chart/radar chart from scratch on EdrawMax.
Using Templates To Create Spider Charts in EdrawMax (Fast!)
EdrawMax also comes complete with ready-made templates. Here’s how you can find them.
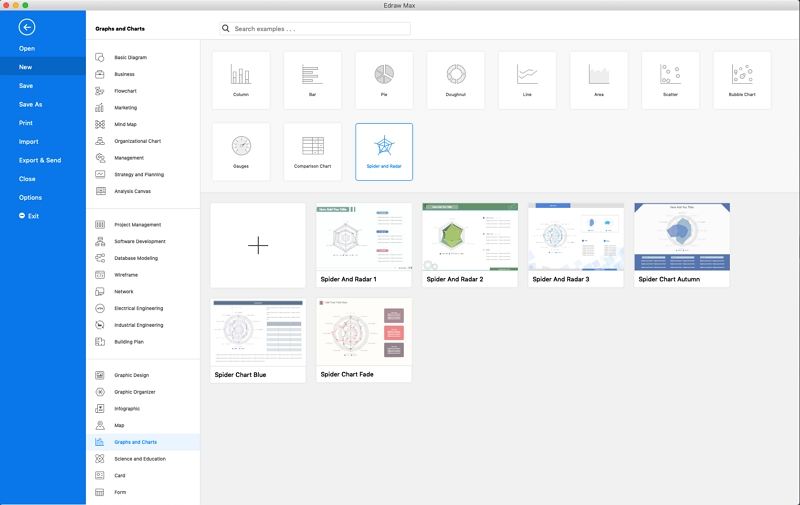
- Click on New → Graphs and Charts → Spider and Radar.
- Click on a template (for this example, we will use Spider And Radar 1).
- ...And there you have your template! Simply follow steps 4 and 5 from above to input your data and finish creating your Spider Chart.
To see everything all together, here is a video tutorial on creating a spider chart/radar chart using an EdrawMax template.
Key Takeaways
Spider charts, radar charts - whatever you wish to call them, they are undoubtedly one of the most useful types of charts available to you. Very few charts allow you to compare multiple sets of data so quickly and visually as spider charts do. Be sure to follow these steps and video guides, and visit EdrawMax to explore what else you can create with its tools!


