How to Draw Context Diagram
1. Introduction
Context diagrams are highly essential as they allow you to represent the dynamics and working of a system in its chronological/sequential order while simultaneously indicating the effects and consequences of external factors, actors, and stimuli at different stages and levels.
Using context diagrams is beneficial and advantageous as they are simple to peruse, easy to understand and they quickly convey the procedure of a system without resorting to meticulous details.
Knowing how to draw context diagrams is of utmost importance in cases where the feasibility of a system has to be evaluated. In this guide, you will learn some basics about context diagrams and how you can easily make them.
2. What to Know Before Creating a Context Diagram
Before we see the steps on how to draw context diagrams, let us first look at some important concepts and things that you need to know beforehand.
1. Establish the boundaries of your system
The first step that you need to do in creating a context diagram is the establishment of the boundaries of the system. In other words, it should be determined what functions and processes are found in a system and where the constraints of the system end.
2. Identify and enumerate the external entities and factors
Since the core concept of context diagrams is to show the boundaries of a system, and the dynamics of the external factors, the next thing that needs to be done is the identification and enumeration of the said factors/entities. The identified entities should be compiled and structured in an organized form to facilitate easy representation and placement when it comes to actually position them in the diagram.
3. Understand data flows and the impact of each external entity
Data flows are defined as the representation of the interaction that occurs between the system and the external agents. Data flows are typically shown using arrows that flow between the system and the external factors. In order to delineate the information or the type of effect that is being carried by the data flows, a label is put along the arrow.
4. Create your Context Diagram
Once you are done with procuring the necessary information, the next thing is to create the context diagram. The steps that are involved in the creation of this diagram will be explained in the next section.
3. How to Create a Context Diagram
Now that we have understood all about context diagrams, let’s get right down to business. Given below is a stepwise tutorial that you can follow to create your own context diagram using EdrawMax Online .
The first thing that you need to do before you start using EdrawMax is to sign up or to log in if you are already a member.

Here is the window you will see when you want to sign up. If you are already signed up, simply click on the 'Login' below the button.
On the left-hand side, you will see a menu. From the top of this menu, choose 'New'. Select 'Flowchart' from under the 'General' tag. Once you select 'Flowchart', select 'Data Flow Diagram' and then choose 'Blank Drawing'.
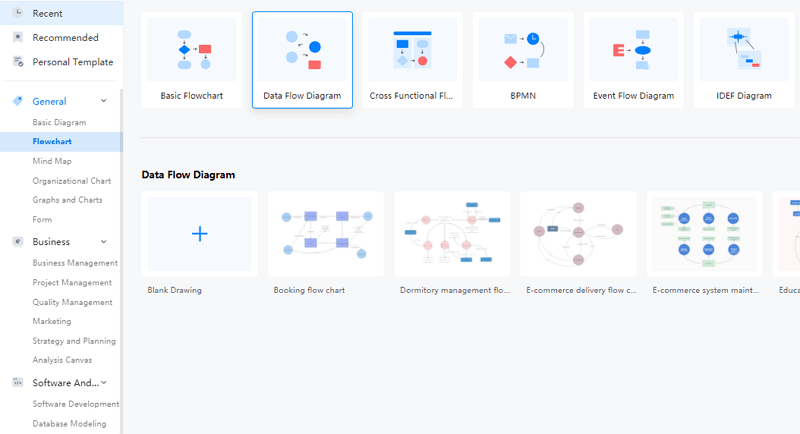
Once you have opened up the blank drawing and you are on the canvas, you need to put in the shapes to make your context diagram.
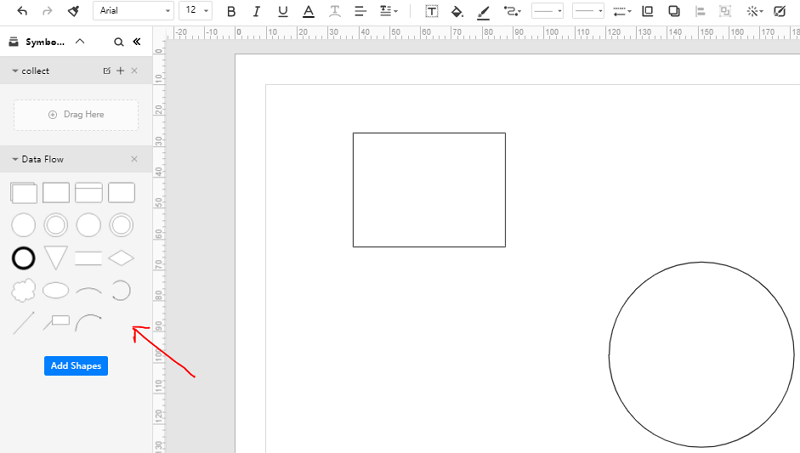
From the menu on the left, you can select your desired image to put on the canvas. Simply click and hold on your desired shape and then drag it over to drop it on the canvas.
After you have created the set-up of your diagram using the desired shapes, you need to use some tools in order to connect them to each other, color them, and overall style them to your liking. These tools are found in the bar located at the top of the window.
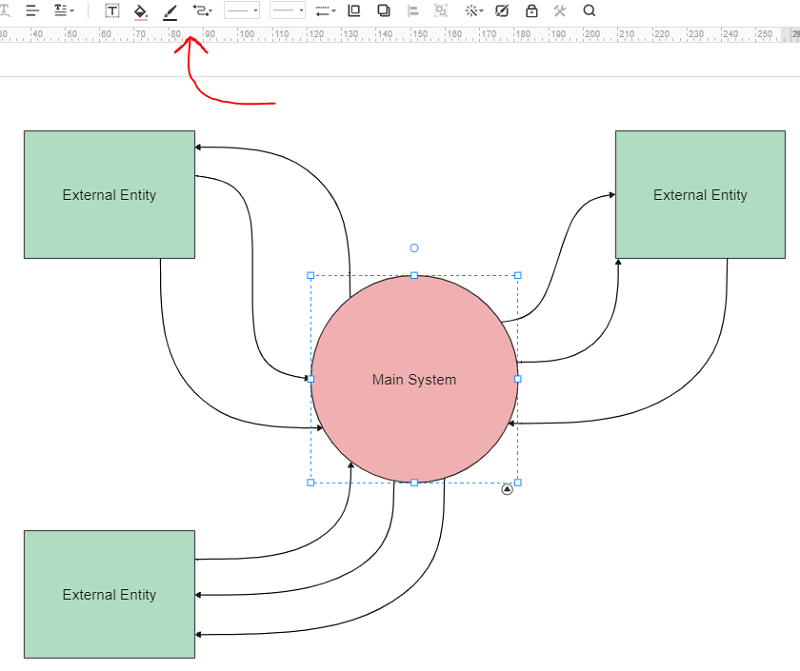
You can use different types of connectors to show the data flow in your diagram. You can also use the 'Fill' and 'Line Fill' functions to add some color to your diagram if you want to color code some elements, or if you just want to make it more pleasant to look at.
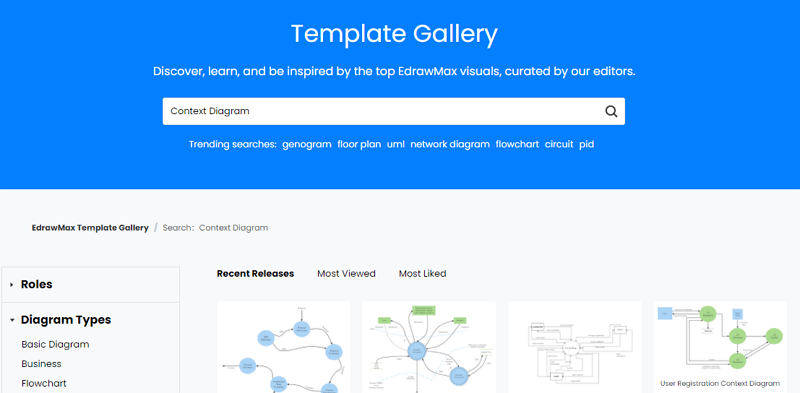
If you don’t want to create a context diagram from scratch, EdrawMax Template Gallery gives you the option of choosing from different pre-set templates that you can simply edit as your own. Simply head over to the Template Gallery and search ‘Context Diagram’ to see the available templates.
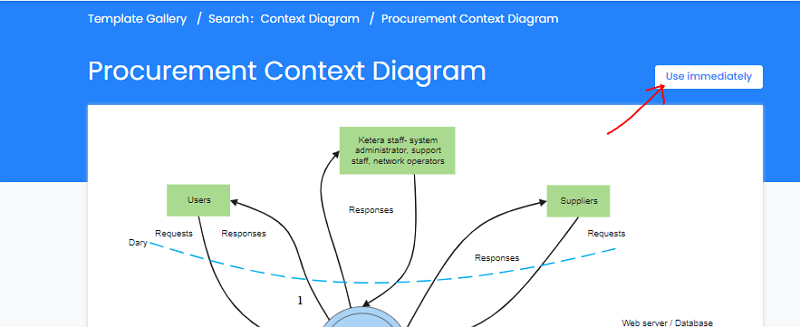
Click on your desired template. At the top right corner, you will see a ‘Use Immediately’ button that will enable you to edit the template instantly on the site.
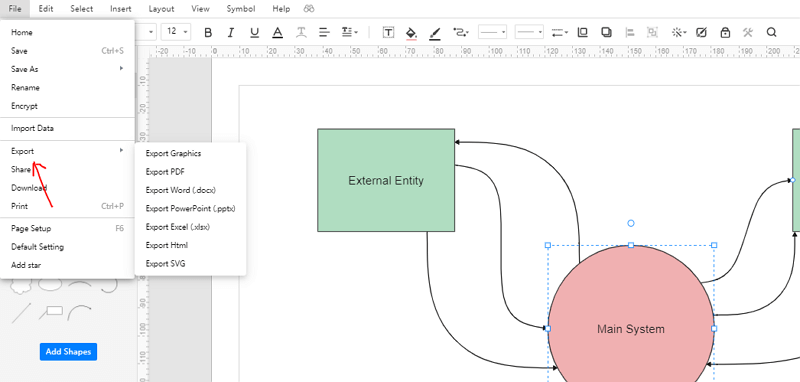
Once you are done with your context diagram, you can save it on your Cloud, or you can export it to any other file format you like and download it to your device.
4. Expert Tips for Creating Context Diagram
1. When making the context diagram, place your system in the center and arrange the effecting entities around it. It is also advisable and somewhat important to make your system larger than the rest of the shapes in the drawing. This helps in conveying the idea of what is the main component and what are the factors that affect it.
2. Give your system a different color and the external factors a different color. By color-coding the entities, you can make your drawing easier to read, and look more professional
3. Provide a legend or key for the different shapes and colors that you use in your drawing
4. Use a dotted line to show where the constraints of your system end and where the outside environment starts. For example, the Procurement Context Diagram that we saw above has a dotted line to show where the system ends. The green-colored entities are placed outside the system since they are external factors
5. Be consistent with the sizes and shapes. If you are planning on placing entities around a system that are of a similar nature, don’t differ in their color, shape, or size. Make them all consistent and similar so that the reader can automatically categorize them in their mind
Wondershare EdrawMax
EdrawMax is the easiest diagramming tool that serves all your purposes. Try Free Online now!


5. FAQs about Creating Context Diagram
What is Context Diagram in DFD?
A Context Diagram is also referred to as a Level-0 Data Flow Diagram or a Top-Level Data Flow Diagram. This essentially means that context diagrams can be described in DFD terminology. Level-0 Data Flow Diagrams consist of a single process node and are generally devoid of details about the working of the system. The nomenclature viz. the name ‘Level-0’ can be linked to the fact that these diagrams only have one process node. The name also points to the fact that these diagrams present the system in the most basic and abstract method.
What is System Context Diagram?
The concept behind a ‘System Context Diagram’ is basically the same as that of simple ‘Context Diagrams’ that we have looked at so far. System Context Diagrams are used to show the entire working and functioning of a system as a single process. The external actors and entities that affect this process are depicted in the System Context Diagram.
These diagrams are very basic in nature, and they convey the very core concept of the system along with the external impacts.
What is the difference between Context Diagram and Diagram 0?
Diagram 0 is also referred to as Level-1 DFD. This is in contrast to Context Diagrams which are described as Level-0 DFDs. The main difference between these two types of diagrams is the level of detail they aim to delineate. The Level-0 DFDs merely show the entire system as a single process, without resorting to any details about the internal smaller procedures, etc. However, Diagram 0 also shows the major sub-processes that constitute a system. This level of detail is not found in Context Diagrams.
6. Key Takeaways
- Due to their simplicity and ease of perusal, Context Diagrams are a great way to describe the working of the function along with the impact of the external stimuli.
- The second takeaway is that context diagrams are easy to make. By using shapes, text, and arrows, you can come up with a creative depiction of a system while enumerating external consequences.
- Unlike other detailed and complex diagrams, context diagrams don’t require the reader to have a lot of relevant acumen and understanding.
In light of these takeaways, we can appreciate just how efficient and useful context diagrams are. Learning how to draw context diagrams is a highly useful yet low-effort activity. By using EdrawMax Online , you can make yours from scratch, or edit preset context diagram examples to come up with professional diagrams to represent your system and the factors that interact with it.
