What is A Context Diagram with Examples
Create a Context Diagram on Edraw.AI Online Free Free Download Free Download Free Download Free DownloadWhat is a Context Diagram?
Also referred to as the Level O Data Flow Diagram, the Context diagram is the highest level in a Data Flow Diagram. It is a tool popular among Business Analysts who use it to understand the details and boundaries of the system to be designed in a project. It points out the flow of information between the system and external components.
It is made up of a context bubble, first drawn in the middle of the chart. It is usually a circle shape that represents a conceptual boundary that encloses a group of interconnected processes and activities of a project. The nitty-gritty details of the internal structure of a system are masked in a context diagram since it is strictly a high-level view of the system. This process is called information hiding.
A context diagram makes part of the requirements document in a project. Unlike other project diagrams, the Context diagram is not for use by the engineers/technicians but the project stakeholders. It, therefore, should be laid out in simple and understandable language for easy understanding of the items by the stakeholders when they analyze it.
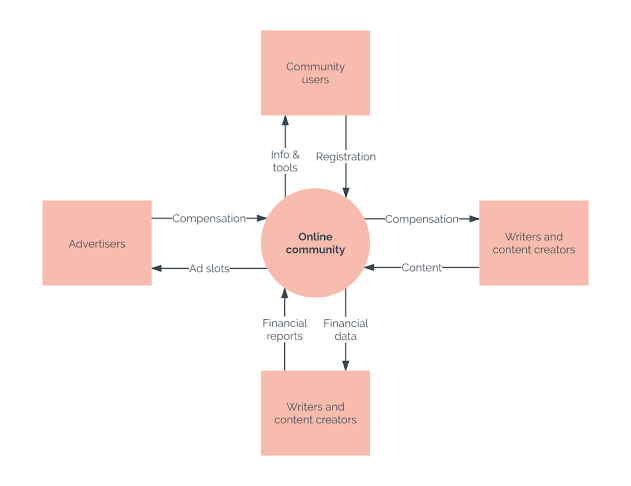
Image Source: lucidchart.com
When to Use Context Diagram?
Of great importance to project stakeholders, the system context diagram draws all attention to external factors and events to consider in designing a whole set of a system’s restrictions and requirements. It is essential at the beginning of a project to help decipher the project domain you are investigating.
A system context diagram represents all the external components that may interact with the system, hence displays the entire software system as a unit. This type of chart puts the system in the middle and surrounds it with its external parts, associated entities, and surroundings. Details of the interior structure of the system are explicitly left out.
Also, a context diagram can be used to reduce risks in a project greatly. Since they are mostly useful for the business partners in a project, they are very keen to spot high-level design bloopers that would have otherwise cost them a plan. Hence reviewing a context diagram is useful in setting the project’s budget correctly.
What are the Benefits of a Context Diagram?
In case you have not been using Context diagrams in your projects, you will make it part and parcel of your project process after finding out its benefits from the list below.
- Context diagrams are an excellent tool for facilitating brainstorming among those design and analyze them.
- A context diagram is suitable for noting omissions and blunders in a business plan or project requirements. Hence you can make necessary corrections and adjustments before the project execution and reduce project risks.
- It also makes a skeleton, simply and straightforwardly, of the project’s scope. It enhances the revelation and confirmation of advanced events that initiate the entire project’s processes like the external components, inputs to and outputs from the project process, and initial sub-process requirements.
- It is easy to make amendments on a context diagram, and if need be, it can be expanded to several levels to display more information that has recently come up.
- There is no limit to the shapes and symbols used in drawing a system context diagram: you can use rectangles, ovals, stick figures, or pictures to assist in quickly showing the bigger picture of a system.
- By representing the application’s downstream user groups and systems, context diagrams help clarify which user groups, the development crew considers, to be its customers. It makes it easier for project sponsors to decide in which project to invest.
- It doesn’t require technical skills or knowledge to understand a context diagram.
Limitations of Context Diagrams
There are some shortcomings in using a context diagram:
- System context diagrams fail to give details about the sequence or timing of project processes.
- They take a long time to create and are prone to errors.
That is pretty much where system context diagrams fail to display data sources, external communications, alternative scenarios, or anything outside the primary function or system. Data flow diagrams make up for it. In these flowcharts, workflows, and actors that kick start data flows are clearly visible. They show the entire project process with actors. Context diagrams, on the other hand, are restricted to displaying the process at hand only.
Context Diagram vs. Data Flow Diagram
It is not shocking when someone confuses a context diagram for a data flow diagram or vice versa. These two are closely related and have some commonalities. We shall discuss them as well as what sets them apart in this section of the article.
|
Context Diagram |
Data Flow Diagram |
|
· Both can be used to analyze a system that already exists as well as design a fresh one. · Both use a standardized set of symbols and shapes to explain the four components of a system: external items, processes, data stores, and data flow. · They display information on the same data flow, showing the processes with room for adjustments and corrections. |
|
|
Context Diagram |
Data Flow Diagram |
|
· The processes are business activities |
· The methods are software programs, manual procedures, and how information is processed. |
|
· Datastores are collections of information. |
· The data stores consist of databases, computer files, and paper files. |
|
· It models a new set of activities and functions. |
· It models a new system of implementation. |
|
· It captures the current and necessary activities required for a process. |
· It displays current software, hardware, databases that need to work. |
|
· It serves as a communication tool among non-technical personnel involved in business activity. |
· It provides the system’s technical crew with a guideline on how to drive the project process. |
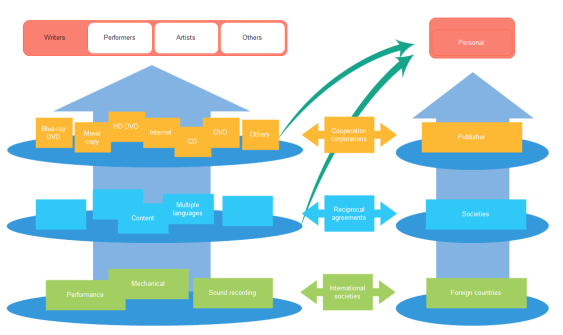
Context Diagram Examples
Since they are easy to make and read, the system context diagram gets utilized in most firms and business fields. For instance:
The graph below depicts the necessary components in a computerized system that distributes and stores the hotel information. It assists hotel managers in running their sales and online marketing activities, allowing them to update their room rates and vacant rooms and making them visible on their sales channels. These comprise both online and conventional travel agencies.
Image Source: https://online.visula-paradigm/system-context-diagram-example/hotel-reservation-system
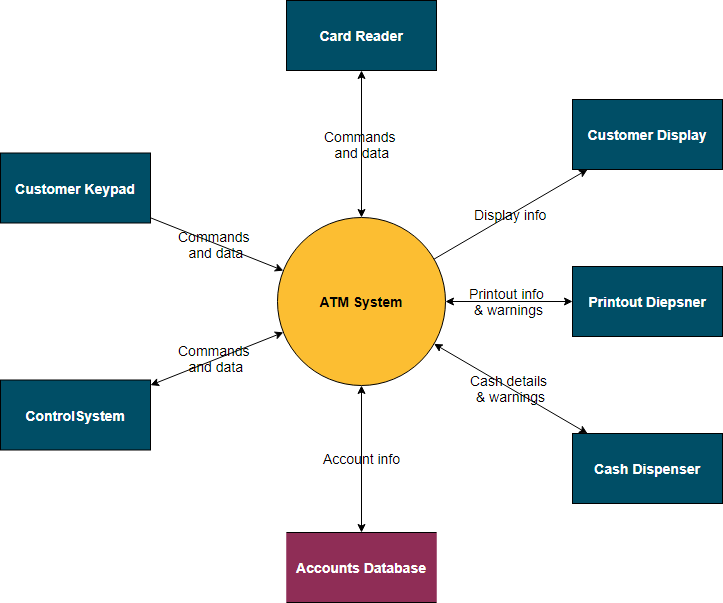
Image Source: https://online.visual-paradigm/system-context-diagram-atm-system
In the diagram above, a context diagram is used to display the Automatic Teller System software plus the hardware that interacts with it. The arrows indicate the directions and the types of data flowing between the software and every single hardware component.
In a brand-new e-commerce website designed for a retail chain, a context diagram is used to show the relationship among the external components made up of the customers, staff, management, and payment system. It is ideal for ensuring that all involved parties are on the same page from the word that go and defines the scope of the business project on a different advanced hierarchy.
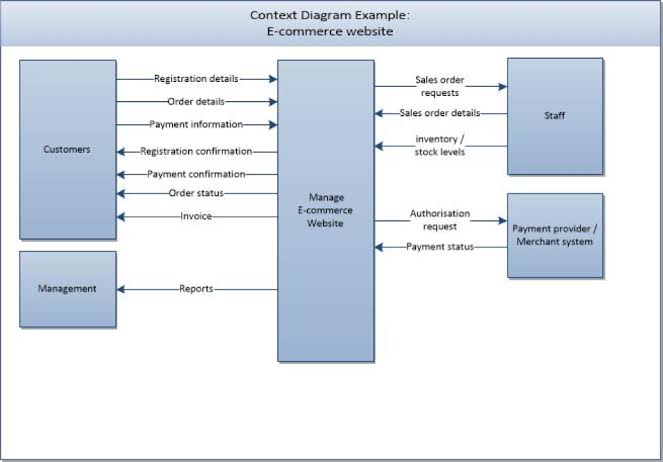
Image Source: https://www.analyze.co.za
How to Create a Context Diagram with EdrawMax?
Here you will see how to make a Context diagram by yourself with the help of a fantastic software known as EdrawMax. You can use it online directly from the app’s website and save a lot of storage space. Sign in through https://edrawmax.online.com.
Before making a context diagram, you need to ensure that:
- Read the story. You may need to write one if it is missing.
- You should mark out the entities (external and internal) and activities in the story.
- Make a table for the identified entities and activities and number them systematically.
- Point out the data flow in the table you made.
- Sketch the bubble diagram.
- Find error routines in the table and remove them.
- Chronologically organize the remaining components.
- Group the activities into appropriate process bubbles then head on to draw the system context diagram with the steps given below.
Step 1: Sign in to the software’s webpage, create an account, verify, and log in. Tap on the Home icon and click on the + page to open a drawing canvas.
Step 2: Click on Open Libraries and select the appropriate category. It is advisable to use the templates in System Context Diagram Templates to get a picture of what you need to draw.
Step 3: Next, drag the correct shapes and drop them onto the canvas to create the context diagram. To write into the form, double click on it. Adjust the shape’s size, position, or orientation by selecting it and use the control handles.
Step 4: To join the shapes, tap on the Connector icon. There are four types of connectors. You can add text to explain a connector by double-clicking on it and jotting the description.
Step 5: Finally, once you are OK with the created diagram, click on the File menu and select Export and Send option. Choose the format and the location to which the layout will save to then tap on Save.
Tips on Making an Ideal Context Diagram
Before penning off, we’ll leave you with a cheat sheet on ensuring you make a context diagram that stands out.
- Start drawing the diagram in the center of the canvas.
- When listing external entities around the system, list the ones directly connected.
- Describe the relationship of the external components, as a unit, integrating them into a system. Talk about the type of information the group will need from the system and the significant interactions with the system.
- Exhibit the relationship by a line running from the unit to the system. Show the direction of the details flow with an arrow on every track. NB: information can only flow in one direction. Do this for all the external entities around the system.
In this window, you can create your wiring diagram by choosing different wiring diagram symbols from the symbol library. There are various symbols available such as transmission path, qualifying symbols, semiconductor devices, switches and relays, and other necessary electrical symbols.