The Logical Network Diagram Explained
Create a Logical Network Diagram Online Free Free Download Free Download Free Download Free Download1. What is The Logical Network Diagram?
A network diagram represents a computer or telecommunication network visually, and is very important to managing network and information technology infrastructure efficiently. Network diagrams include two different types: logical network diagram and physical network diagram.
A logical network diagram explains the logical components of the devices of a network, it includes cables and hardware. Just like the floor plan, it shows the physical layout of a network.
2. Why Use The Logical Network Diagram?
Logical network diagrams are useful for engineers, they can be used in different ways to manage networks more effectively:
- Troubleshooting network problems: Logical network diagram can help you quickly rule out an issue caused by a firewall if service is out between two IP addresses;
- Firewalls: Logical network diagram will help you make sure that your firewall rule bases are accurate;
- Eliminate redundancies: Logical network diagram will help you determine redundancies;
- Capacity planning: Logical network diagram can help you map out expanding or changing the network;
- Sharing network information: Logical network diagram will help you out if you need to share information about the network confidentially.
3. What is in the Logical Network Diagram?
A network diagram is a visual representation of a system, it uses symbols to deliver its meaning and represent relationships between physical entities.
(1) Logical Network Diagram Symbols:
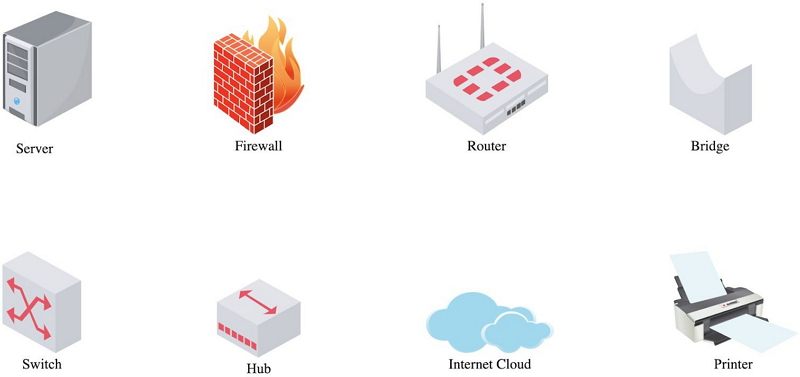
Moreover, Cisco Systems, Inc. is one of the world’s largest networking equipment providers. They have developed a set of symbols that represent their equipment.
(2) Logical Network Diagram Events:
An Event is represented by a circle and means completion of activities and starting of new ones. Events can be classified into three types:
- Where one or more activity connects with the event and merges is called a merge event;
- Where one or more activity leaves an event is called a burst event;
- Where one or more activity merges and bursts at the same time is called a merge and burst event.
(3) Logical Network Diagram Sequencing:
Sequencing refers to the prioritization of relationships between activities.It alludes to how devices or activities act in an arrangement as data is transmitted.
4. Types of Topology for Logical Network Diagram
Network topology is the arrangement of the components of a network. It can describe both physical and logical aspects of a network. Topologies can be classified into five types:
- Bus Topology
- Ring Topology
- Mesh Topology
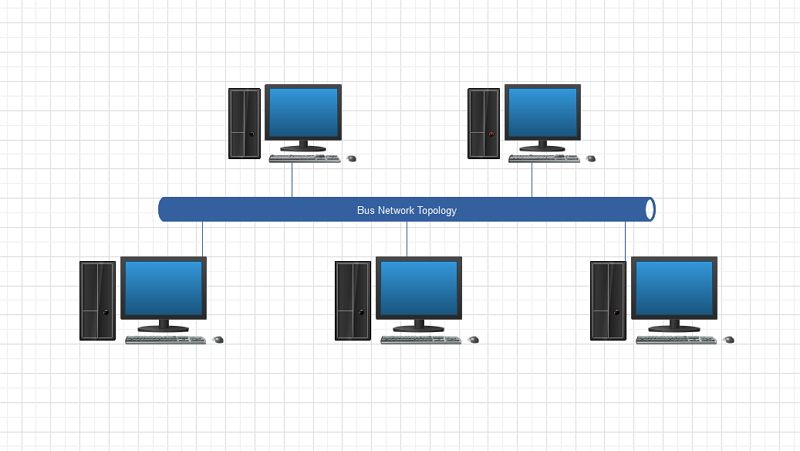
A bus topology is also known as a backbone, linear, or ethernet topology. A central medium (the “bus”) which has exactly two endpoints, connects all of the nodes. Bus topologies are easy to configure and require less cable than some other topologies. If the central bus breaks down, however, the whole network will also break down, which will make it difficult for troubleshooting.
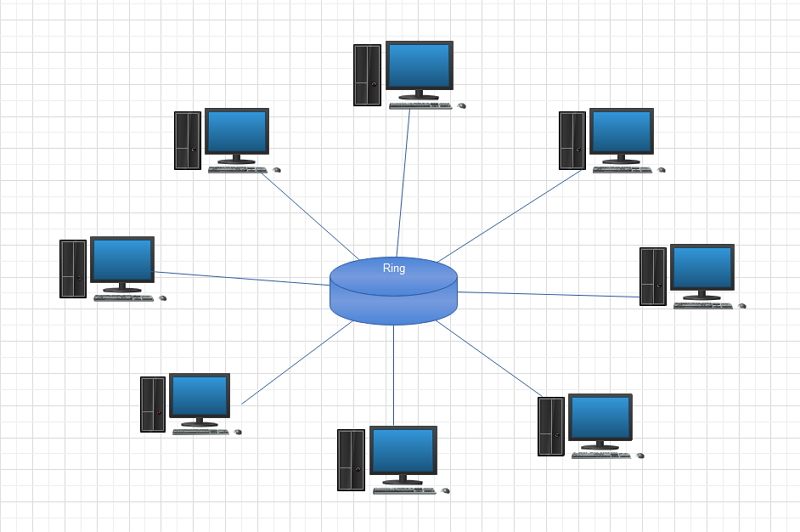
A ring topology is made up of nodes connected in a circular pattern. Information is sent through the circular pattern until it reaches its destination.
Just like the bus topology, when one node breaks down, the whole network also does. Even though bandwidth is shared across all the devices and connections, ring networks can outperform bus-based networks. Also, they can outperform those based on the bus topology, and can be easily reconfigured to add or remove devices.
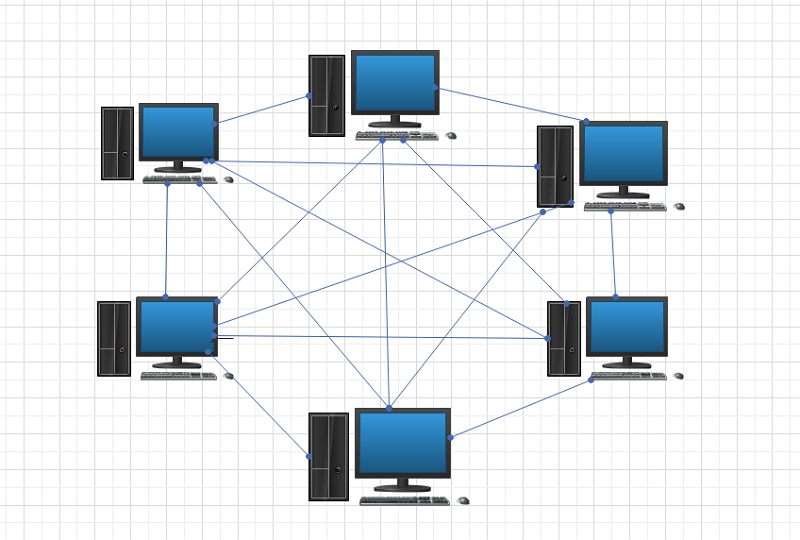
There are two types of mesh topology, including full mesh topology and partial mesh topology. In full mesh topology, each node is directly connected to every other node. In a partial mesh topology, nodes are only connected to the nodes they interact with most.
5. How to Create The Logical Network Diagram in Edraw Max?
There are 5 steps in total to create logiacl network diagram with minimal efforts and export in multiple formats, as well as share it to friends and collueagues.
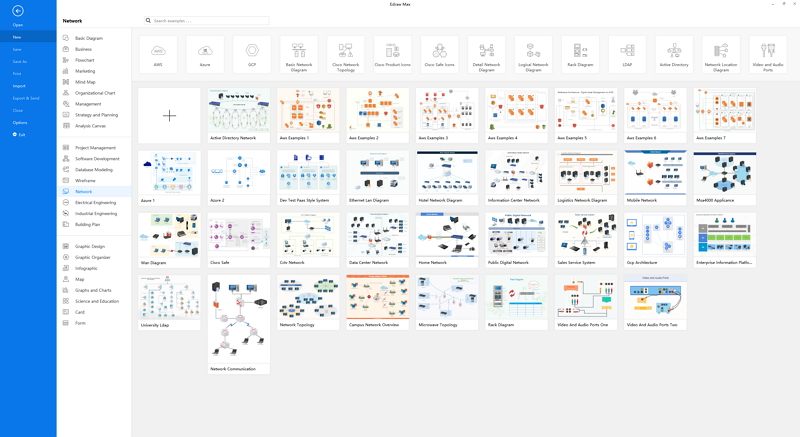
- Open the Edraw Max online or download its software, then login by email or social media account;
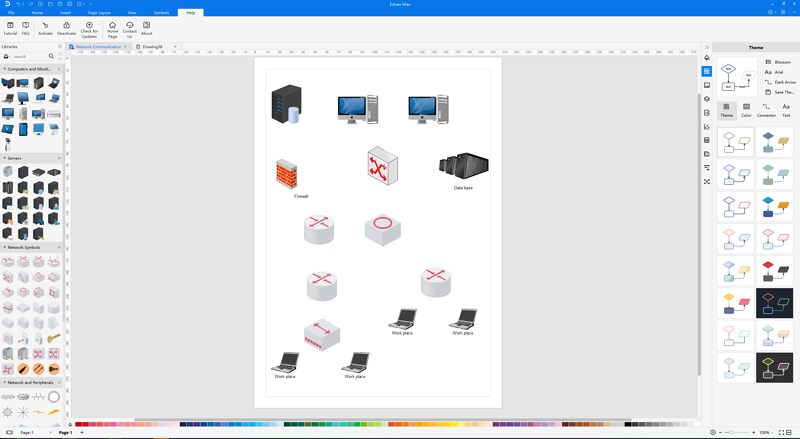
- Identify the equipment. Simply list all the workstations, servers, switches, firewalls, and different segments that are a piece of the system. You can achieve this by basically hauling shapes onto the canvas in Edraw Max;
- Group the shapes. To start, draw related shapes nearer to each other. Shapes might be connected either logically or physically, contingent upon what sort of graph you're drawing;
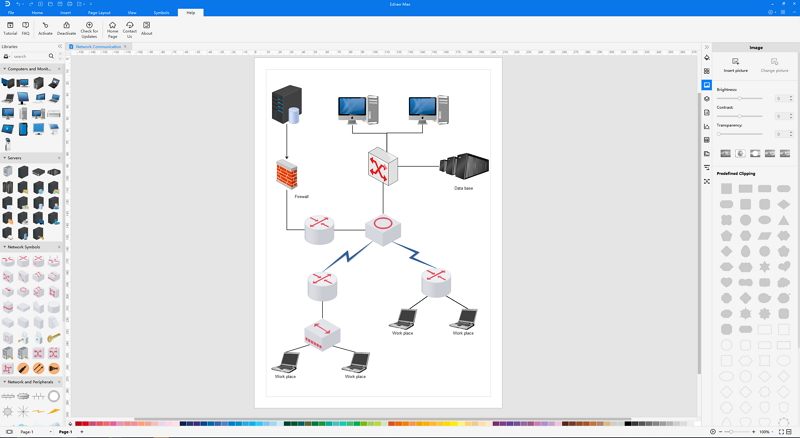
- Add connections. A line between two shapes shows that they are associated some way or another, typically by the flow of information. Adjust the placement, size, color, and other attributes of your diagram elements until you like it;
- Save the file as the formats you want, including Graphics, PDF, PS, EPS, Office, Html, SVG, Visio. Or, you can directly email it to your friends and colleagues.
6. Key Takeaways
A logical network diagram explains the logical components of the devices of a network. As mentioned above, all you need to do is to drag and drop symbols, lines and shapes to represent connections. You can also choose one of the hundred templates we have on Edraw Max to save your time and make things easier. With Edraw Max, you can use one of the multiple network diagram templates available, this tool will help you make professional Logical Network Diagram more efficiently.


