The Physical Network Diagram Explained
Create a Network Diagram Online Free Free Download Free Download Free Download Free Download1. What Is A Physical Network Diagram?
As we have often heard that visuals make an impression on the mind rather than simple theory or text. If we talk about the IT infrastructure, which is flooded with a range of devices, Network diagrams act as a one-stop solution in the scenario. It is a schematic that depicts the connections among all the devices in a network, such as servers, routers, and firewalls. It maps out the network architecture and visually explains the different components and connections in a network through symbols, shapes, or icons. An exemplary method to share the layout of any network, it makes the process easier to understand for users. Depending on the requirements, a network diagram can either be very simple or very typical. They are both categorized into two types - physical and logical.
A physical network diagram illustrates the interconnection of the devices in the network with wires and cables while a logical diagram Illustrates the way information flows through a network. To be precise, the physical network diagram reveals the network topology with all the physical aspects, such as ports, cables, racks, servers, specific models, etc. usually used by IT professionals, they are used to visualize the communication scheme of the network arrangement in residences or offices.
2. Why Use A Physical Network Diagram?
The main purpose of physical network diagrams is to provide insights about the different physical components in a network. Another purpose of a physical network diagram is to visualize how every component in the network works to assist with troubleshooting. A clear picture of the elements working together will pinpoint what needs to be remedied when something in the network is not working correctly.
A physical diagram is generally used to visualize the interconnection of network devices and other physical components. It displays the topology and the existence of physical links between devices. Mainly used by IT staff, a physical diagram visually documents the physical connections. They are used to troubleshoot network problems, identify security threats and weak spots, and organize changes in the network.
3. Types of the Physical Topology
The physical topology is the interconnected structure of a local area network (LAN). All the physical devices, when connected to the network through several types of cables, together constitute in making the physical topology.
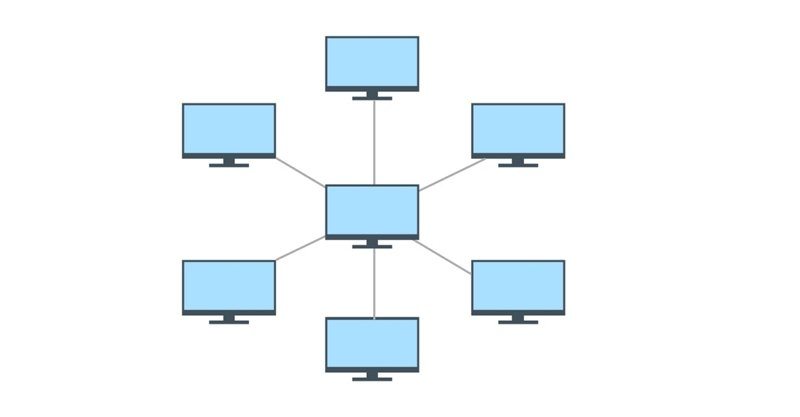
- Star Topology: This topology is employed with a single access point or a switch that acts as the center of the network. All nodes are directed from this singular point.
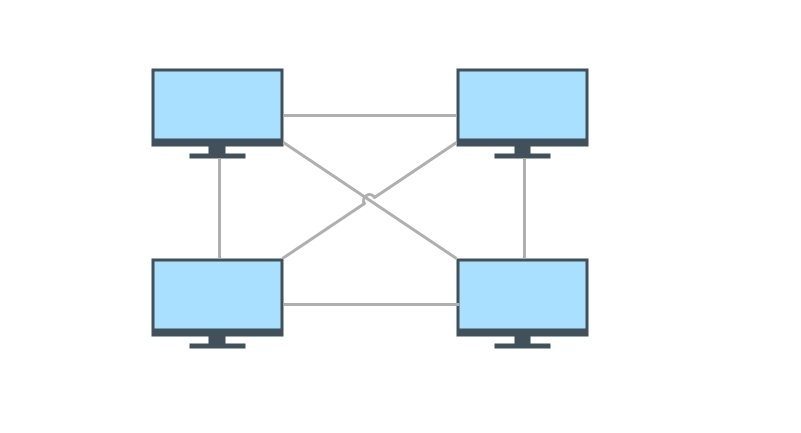
- Mesh Topology: Mesh topology is a network of wires and cables that connects the computers and the network devices. All nodes are connected in a mesh topology.
- Tree (Extended Star) Topology: this typology is employed with multiple access points connected linearly. Then odes are directed from their respective access points.

4. Components, Symbols, and Terms in Physical Network Diagram
- Components
- Connections: Considered as a very crucial element in a physical network diagram, connections represent the wires and cables that connect various physical devices to the network. Different colors and thicknesses of wires are used to describe different connections, such as fiber, copper, etc.
- Labels: Physical diagrams use icons and symbols, and labels help the viewers to identify them. Every active module in the network, such as switches, routers, firewalls, etc. is labeled with a hostname and IP address.
- Diagram Legend: It informs the viewer regarding different graphics, icons, and colors by providing a real-world meaning. For instance, if you have used double black lines to symbolize a kind of cabling, you would name it on the legend.
- Switch Stacks: they portray a single object or device.
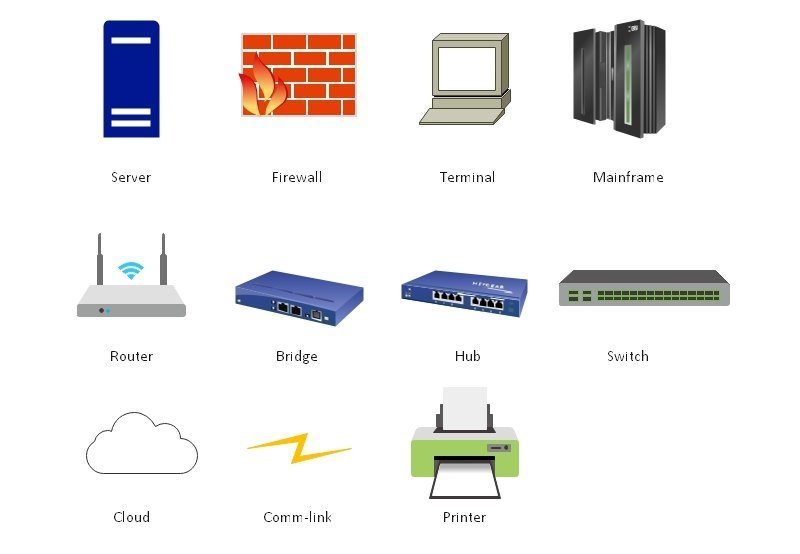
- Symbols
- Common symbols
- Other popular-used symbols
- Terms
- Activities: represented by an arrow, they are categorized into four types:
- Events: also known as a node, are represented as a circle that denotes the activities. They are classified into three types:
- Sequencing refers to the superiority of relationships between devices or activities.
Since physical network diagram illustrates the entire topology of the physical network, it depicts several different material components:
There are many kinds of symbols in network diagrams but we can categories them into two main parts — common symbols and other popular-used symbols.
Common Symbols example in the network physical diagrams would be such symbols that are used frequently, like Router, Bridge, Hub, Switch, Cloud, and others.
Amongst the several ways to build network diagrams, the most popular are Cisco and Amazon Web Services (AWS). In addition to that, Azure, and Google Cloud Platform (GCP), are the generic network diagram symbols and icons.

Some standard terms are used in reference to the physical network diagram.
1) Predecessor activity to be finished before another activity initiates.
2) Successor activity can be started once the due activities are completed. They need to be done in immediate succession.
3) The concurrent activity should be started at a similar time.
4) Dummy activity depicts dependence.
1) Merge events occur when one or more activity connects and merges.
2) Burst event occurs when one or more activity leaves an event.
3) Merge and Burst events occur when one or more activity merges and bursts simultaneously.
5. How to Draw A Physical Network Diagram in EdrawMax?
- Step 1: Establish a hierarchy of levels, look out for the components you need to include for the given network, such as servers, routers, hubs, printers, and others.
- Step 2: After mapping out the components on the diagram, the next step requires you to connect them. Add the relevant symbols. EdrawMax loads the shapes, tools, etc. beginning with inserting the basic components such as computers, servers, firewalls, etc.
- Step 3: Label the symbols to depict the components and connections between your network. Add to the legend for reference.
- Step 4: To represent different types of connections, use different types of lines and different levels of thickness. Use lines and arrows to depict the connections.
6. Network Diagram Examples
To understand the real-life implications of the network diagram, below are two typical network diagram examples.
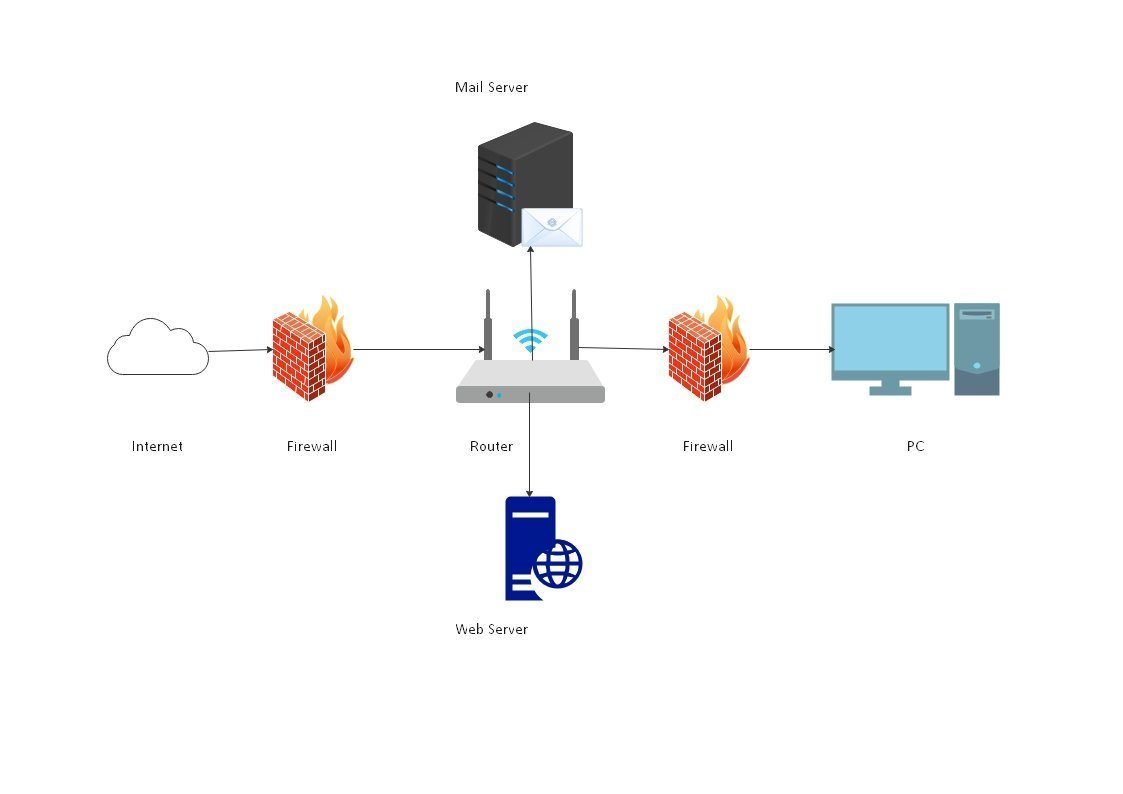
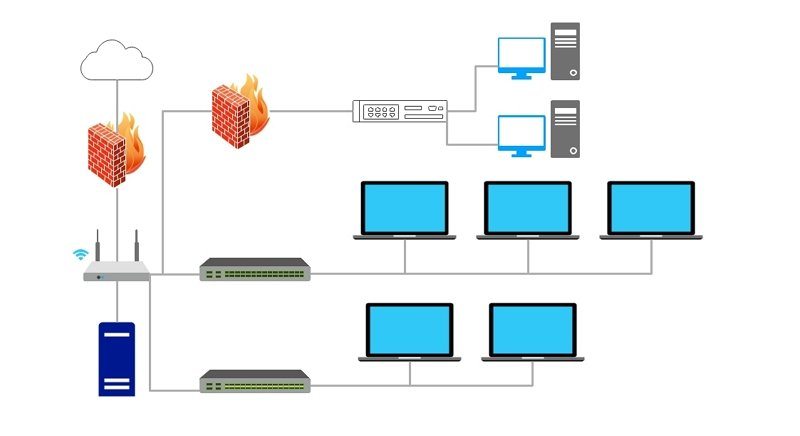
- Network Security Diagram
- Office Network Diagram
Security by far is one of the most important aspects of any organization. A network security diagram helps the user map out the methods and processes that must be followed to create the security protocols. With a correct and effective method, a network security diagram can be created that shows what valuable information can be processed and stored.
The official organization has started to use network diagrams to show the relationships between the installed physical network devices of the office’s network to provide a better understanding of the resources. An office network diagram is a prime example to understand the connectivity among devices that are extremely useful if or when any troubleshoot arises.
7. Key Takeaway
A physical network diagram will show the network topology exactly it is — with all the devices and connections that give valuable insights into the network that enables members of any organization to plan to troubleshoot and resolve the issues without wasting too much time. Use EdrawMax to draw your network diagram with ease.


