Free Editable Scientific Graphic Organizer Examples
When fictional and factual books teach a topic area such as science, a science graphic organizer can help students organize information, classify findings and facts, grasp the links between phenomena, draw inferences, construct explanations, and generalize scientific theories. This procedure eventually leads to a more comprehensive conceptual understanding. Students may also organize and reflect on information collected when they use graphic organizers successfully to manage their science knowledge.
1. What is a Scientific Graphic Organizer
A scientific graphic organizer is a scientific teaching method that allows students to capture information from direct observation and read to build a descriptive model of an organism or phenomena. Concepts, facts, and vocal expressions are visualized using graphic organizers. They are available in numerous shapes and sizes, including descriptive feature charts, T-charts, flow charts, Venn diagrams, tree diagrams, and semantic maps, to name a few. Science graphic organizers depict essential concepts and information about a topic and the pieces' relationships to the whole. Furthermore, research has shown that students who created their pictorial depiction of content in an explanation text had a higher level of knowledge than those who reproduced a picture or wrote a summary.
By offering precise representations of ideas and enabling student reflection, graphic organizers aid learning in topic areas. Leveraging graphic organizers in science class, students effectively used the open-mindedness of graphic organizers to obtain a complete grasp of ideas, according to research performed in a sixth-grade science class students during a weather unit. Students' learning and independence are improved when literacy methods such as graphic organizers are used in the topic areas. They are better equipped to apply these skills independently throughout their lives.
2. The Scientific Graphic Organizer Examples
Many teachers use graphic organizers to improve their students' abilities and comprehension. The following top visual scientific graphic organizers can assist the students in grasping topics and communicating their understanding. They're ideal for inexperienced teachers who need assistance with curriculum preparation, as well as seasoned educators.
|
|
|
| Scientific Method Graphic Organizer | Scientific Graphic Organizer | Experimental Design Graphic Organizer |
|
|
|
| Scientific Method Graphic Organizer Template | Scientific Notation Graphic Organizer | Scientific Notation Graphic Organizer: Frame Diagram |
|
|
|
| Integer Exponents and Scientific Notation | Middle School Earth Science Graphic Organizer | Graphic Organizer for Scientific Content |
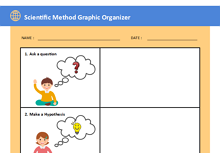
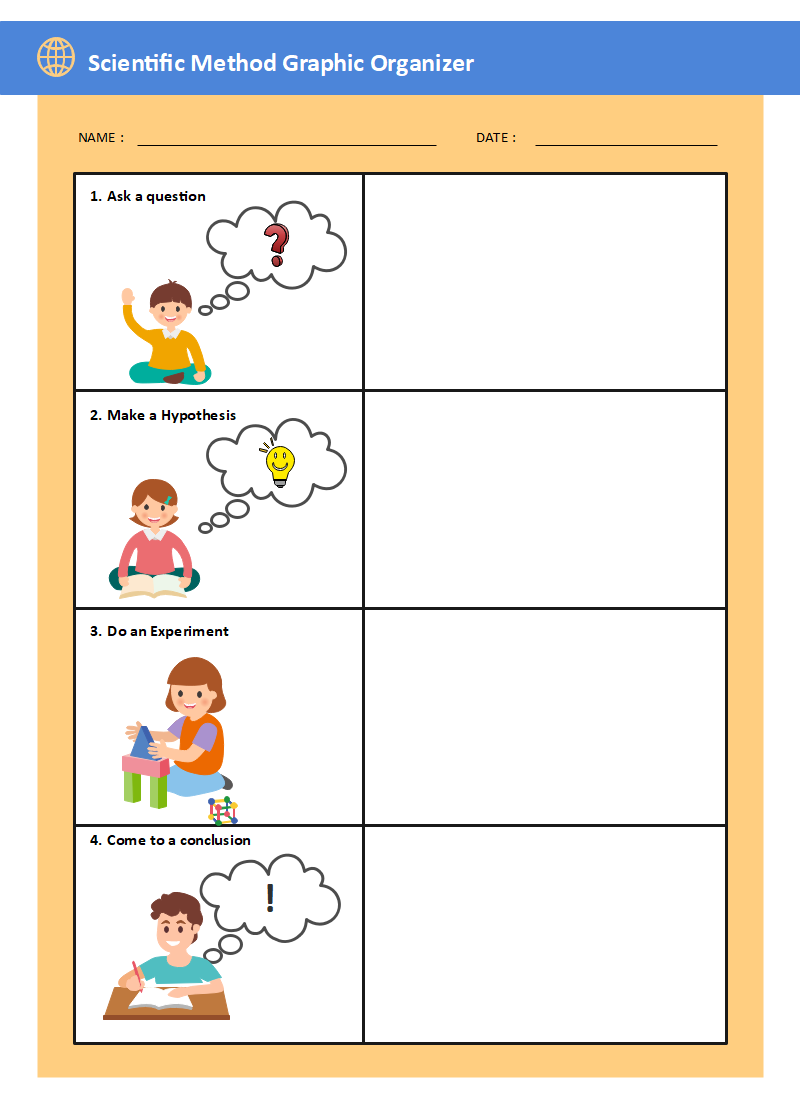
Example 1: Scientific Method Graphic Organizer
A scientific method diagram organizes information regarding an issue or query, an assumption, a technique, data, observations, and findings. This scientific visual organizer/flow chart can aid pupils in their understanding of the scientific method. The arrows depict the process flow, with a return to hypothesis after collecting and analyzing data (so that the students can create a new theory if necessary). The sentence frames in this scientific graphic organizer will help students comprehend and apply the scientific process as well as engage in "writing to learn." It encourages students to approach science as an investigation and to write across disciplines.
 Source: EdrawMax Online Edit Now
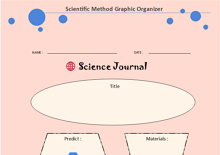
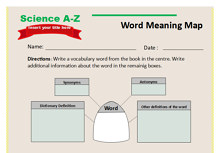
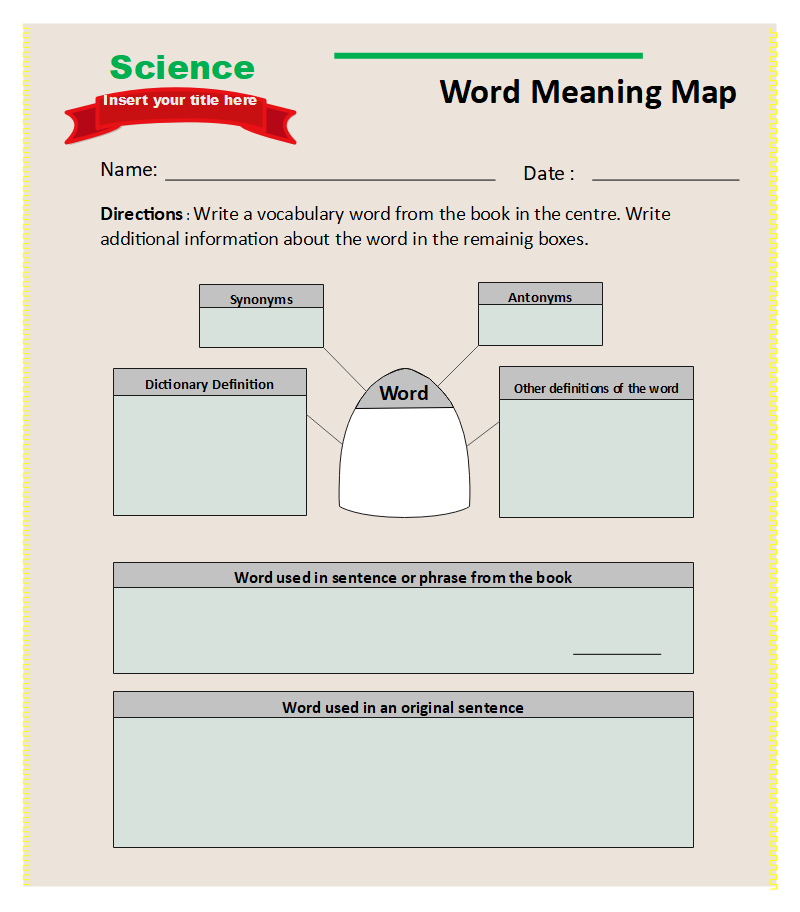
Example 2: Scientific Graphic Organizer
As students read fictional and factual scientific literature, Scientific graphic organizers promote content-area learning and reading ability. Students may utilize Scientific graphic organizers at every step of the learning process, from ideation to displaying final research results. Teachers can use them as formative reading and comprehension tests.
 Source: EdrawMax Online Edit Now
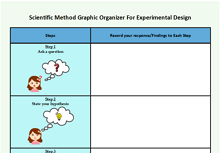
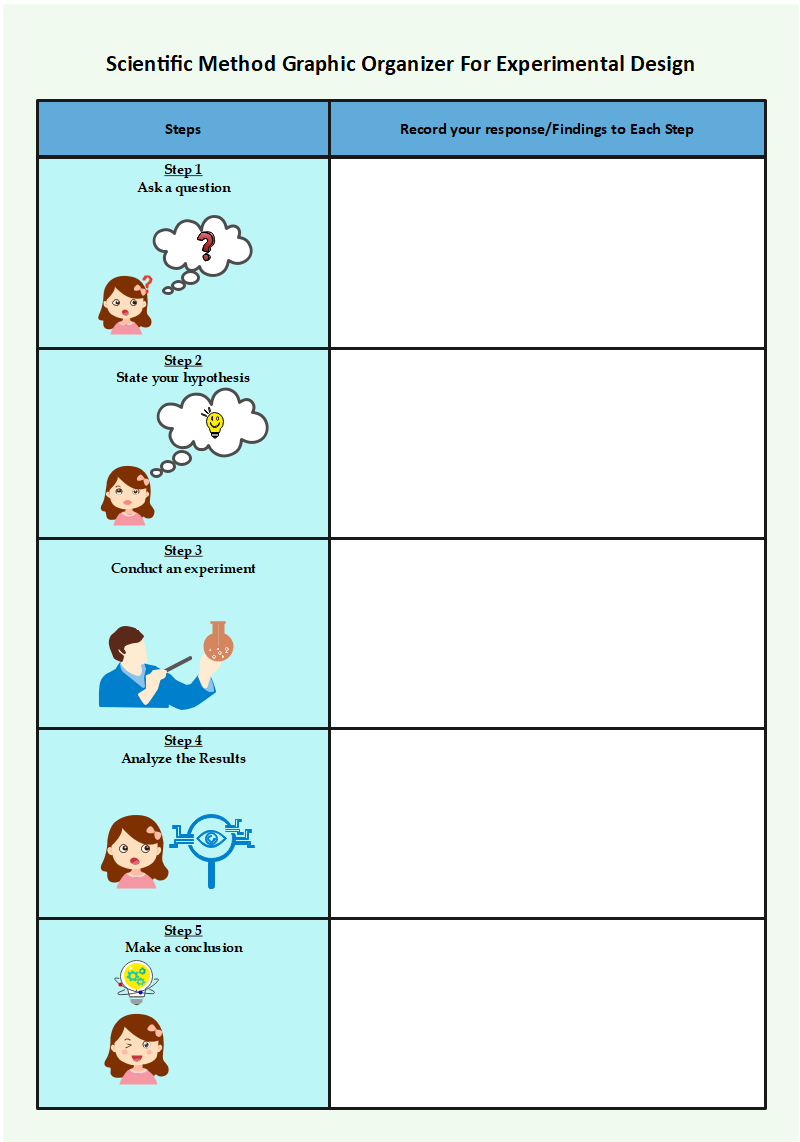
Example 3: Scientific Method Graphic Organizer For Experimental Design
This visual Scientific graphic organizer walks a student or instructor through the scientific method for any experiment. It contains one sentence for each of the following: Query or Concern, Assumption, Process, and Outcome. There are areas for students to include the Isolated Variable, Dependent Variable, and Constants, and room and suggestions for a three-sentence conclusion. It's pretty adaptable, and the teachers can use it for any experiment to allow students to demonstrate what they performed in the investigation and their interpretation.
 Source: EdrawMax Online Edit Now
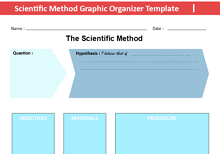
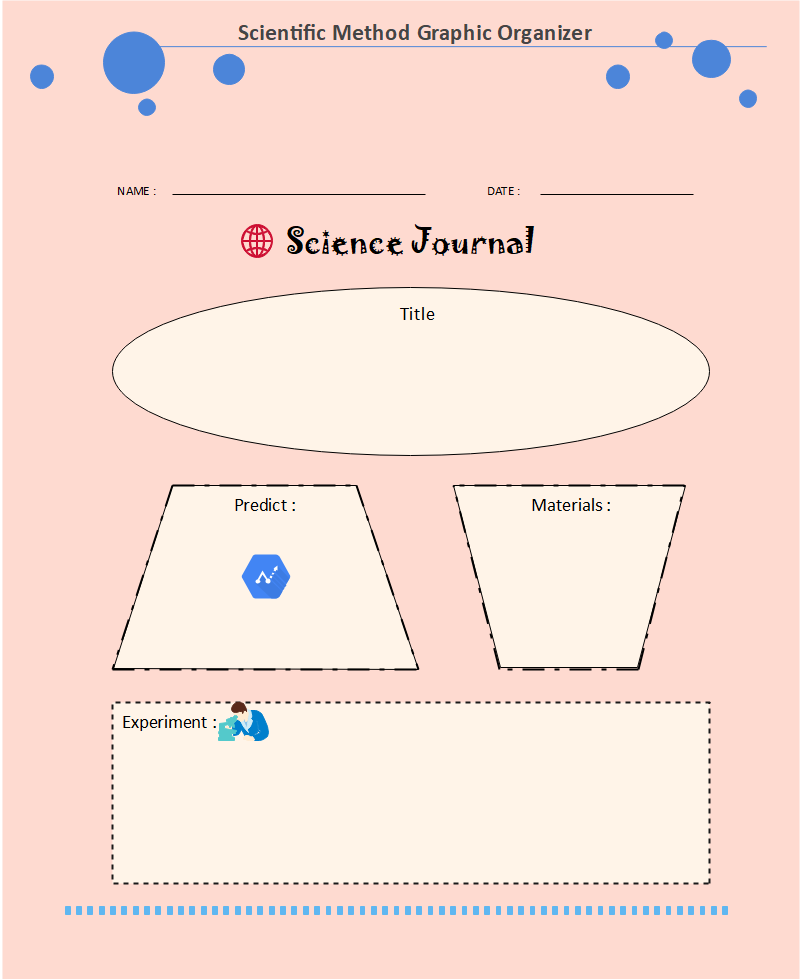
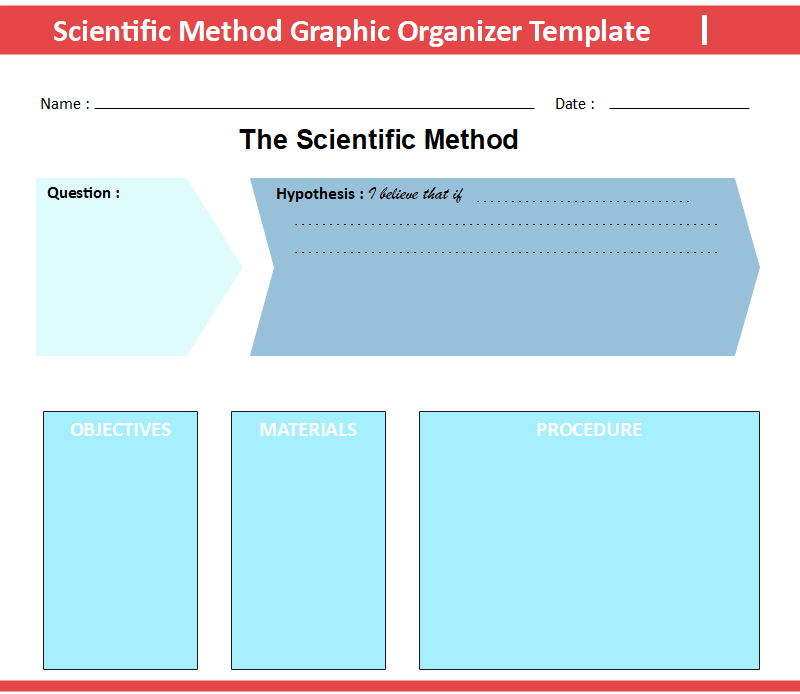
Example 4: Scientific Method Graphic Organizer Template
The teachers may use this visual Scientific graphic organizer /flow chart to assist students in learning about the scientific process. The arrows depict the process' natural flow, with a return to hypothesis after collecting and analysing data (so that students can make a new hypothesis if need be). Between conclusions and convey results, a new section called "remaining questions" is introduced. It motivates students to continue their studies and allows them to present their findings to the scientific community.
 Source: EdrawMax Online Edit Now
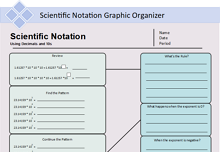
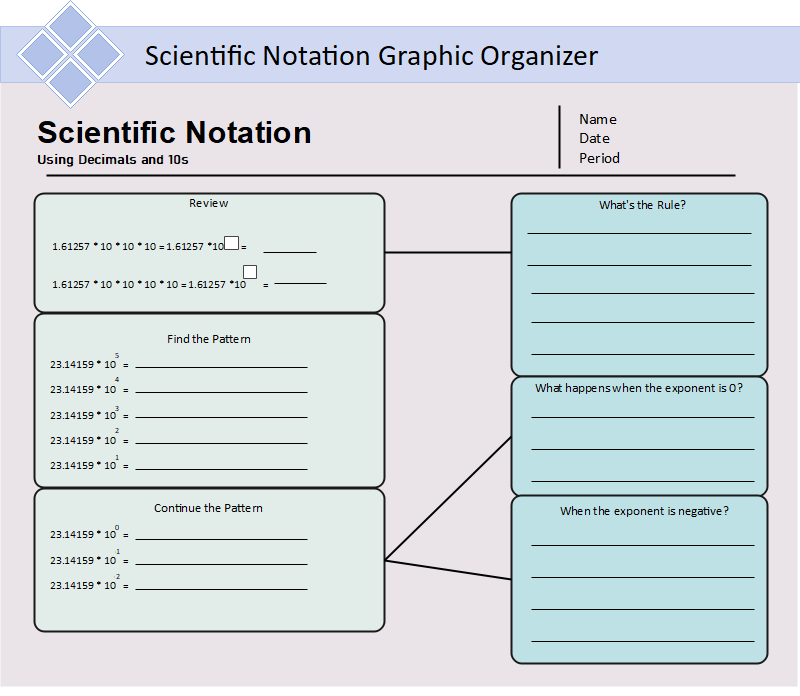
Example 5: Scientific Notation Graphic Organizer
The Scientific graphic organizer for Scientific Notation is ideal for use in an interactive notebook. Its purpose is to offer students an example of a number in scientific notation and experience recognizing the essential vocabulary phrases necessary while discussing scientific notation. There are two variations to help differentiate learning in the classroom. The Scientific Notation Graphic Organizer is highly beneficial for children who require more arithmetic assistance (i.e., special education, math intervention, or ELL students). Students experience real-world applications of scientific notation through specific exercises, and they must defend their decisions based on their past knowledge. Students can argue with one another and generally come up with fantastic questions in determining who is the best.
 Source: EdrawMax Online Edit Now
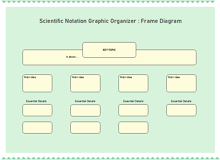
Example 6: Scientific Graphic Organizer PDF
By connecting significant concepts and specifics, "The Frame" aids in developing comprehension of information and procedures. These Content Enhancement Routines were created by the University of Kansas' Centre for Research on Learning. The instructor will utilize the framing technique to assist the pupils in arranging their thoughts. This practice can help challenge students because it allows pupils to revisit previously learned concepts to review preliminary information. The teachers will use the rules of exponents to understand scientific notation by students.
 Source: EdrawMax Online Edit Now
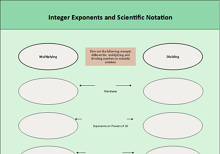
Example 7: Integer Exponents and Scientific Notation
It's a helpful chart that kids may return to over and over. Property names, symbols, examples, and practice problems are included. Furthermore, the Reference chart contains the following information:
The quotient of Powers, Power of a Quotient, Product of Powers, Power of a Power, Product of a Product, Exponents with zero, negative, and rational exponents.
 Source: EdrawMax Online Edit Now
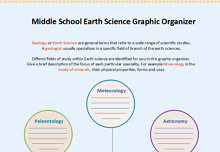
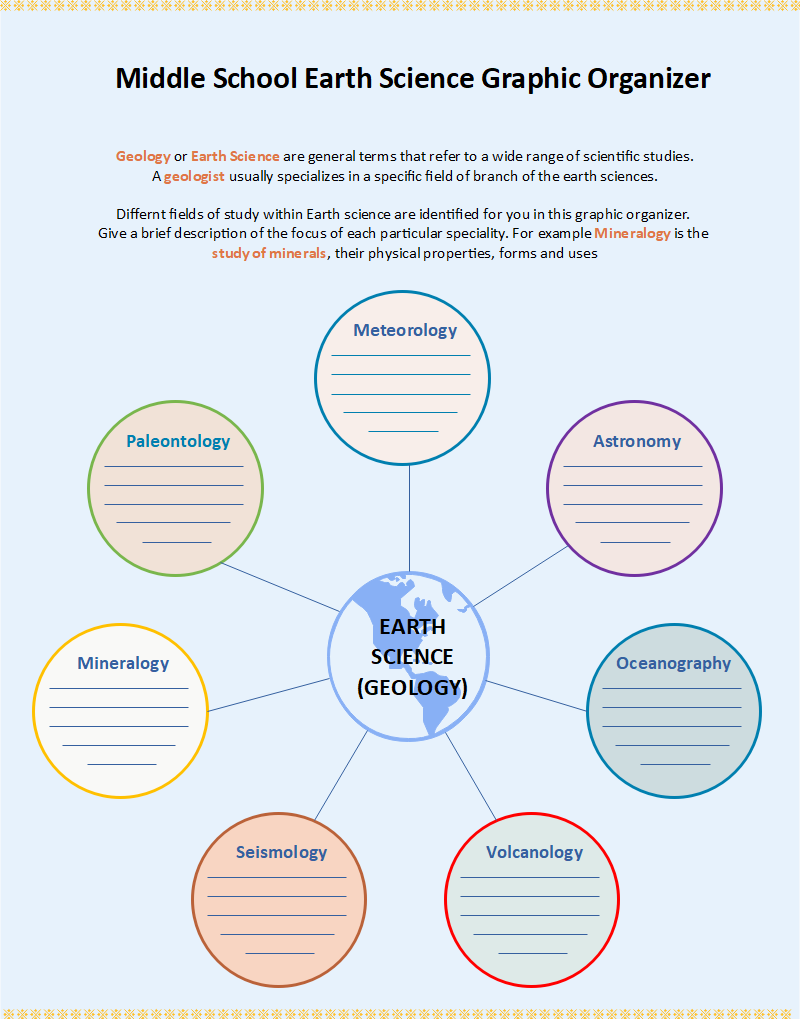
Example 8: Middle School Earth Science Graphic Organizer
The Middle School Earth Science Graphic Organizer is graded and topic-levelled, with illustrated, self-directed visual outlines to assist students in understanding essential, standards-based curricular ideas. Include review questions for each of the 25 subjects to help students solidify their comprehension and prepare for exams.
Source: EdrawMax Online Edit Now
Example 9: Graphic Organizer for Scientific Content
The use of visual Scientific graphic organizers may make learning complicated and complex topics more accessible. As a result, it is critical to provide sample materials for classes. Scientific graphic organizers were created and discussed in this study, and the teachers may utilize them in Science and Technology lessons. Other courses may benefit from the development and use of visual Scientific graphic organizers. If a visual Scientific graphic organizer is used during the lecture, students will easily remember concepts and subjects. When the pupils are instructed, they can also develop their own visual Scientific graphic organizers for their course.
 Source: EdrawMax Online Edit Now
3. Online Scientific Graphic Organizer Maker
If you are looking out for someone who can create good scientific graphic organizers, then EdrawMax Online is your best choice as it is an all-in-one online tool that one needs for intelligent diagramming. EdrawMax Online believes in first visualizing and then actualizing. It is a powerful drawing tool with endless features, templates, and examples for its users to accomplish any task they have set out to achieve. There is no diagram or chart that EdrawMax Online cannot handle. You can find out more graphic organizer examples in the Template Gallery.
Why Choose EdrawMax Online
- Create over 280 diagram types
- Supports team collaboration
- Personal cloud & data protection
- Print, share and download
- Powerful template community
4. Key Takeaways
EdrawMax Online provides more than 280 kinds of diagrams for all your needs, right from flow charts to circuit diagrams that are also content-rich. EdrawMax Online helps one build a real-time synchronous cloud workspace for everyone's collaboration for a seamless collaboration experience with teamwork. EdrawMax Online has over 1500 plus built-in templates and 26,000 plus symbols which are continuously updated. It is a whole studio dedicated to drawers that can discover endless diagram possibilities. What's more, EdrawMax Online lets one tap the power of social media by allowing one to easily export and share the visual scientific graphic organizers in public or private. You can find out more graphic organizer examples in the Template Gallery.
Related Articles


