Free Editable Sequence Chart Examples
Charts make things easy to understand. Whether you are an academic or a professional, it will help you grasp things easily. Sequence charts are similar type of charts that present sequential events in an easy manner. In this article, we will share what these charts are and some examples of free editable ones.
1. What is a Sequence Chart
Sequence charts or sequence graphic organizers are one type of graphic organizer, which helps the audience, students in most cases, to grasp sequential relationships among all events in a given situation or text. It simplifies the complex concepts or complexity in a group of events and present them in a far simpler manner. These charts are also used as one type of communication tool between the employers and the employees, involving various visual symbols, expressing relationships between concepts, ideas, events, and so on. Like all types of graphic organizers, the sequence charts summarize complex items and present them in graphically simpler ways, allowing the audience to understand the concept more easily.
2. The Sequence Chart Examples
When there are a number of events going to take place, it may get a bit hard to keep the record of everything. That is where Sequence charts come in handy. It creates a sequence of the events, which makes it easy for you to keep record of event. You can then easily anticipate what is going to come next. Based on your type of content and necessity, the chart will vary. Here are some examples of free editable sequence charts.
|
|
|
| Sequence Graphic Organizer | Sequence Order Graphic Organizer | 8 Events Sequence Chart |
|
|
|
| Sequence Chart Template | Six Step Sequence Graphic Organizer | Sequence Chart Example |
|
|
|
| Story Sequence Graphic Organizer | Sequence Chart of Project | Cycle of Events Graphic Organizer |
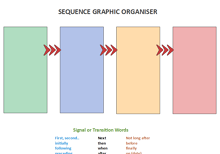
Example 1: Sequence Graphic Organizer
Like all graphic organizers, this type of sequence charts includes some texts presented with graphical symbols. However, as it denotes some sequence, there needs to be a directional pathway among these texts. Usually, the texts or names of the events are presented in some boxes. These boxes are then connected via some directional symbols. They can be different signals indicating the pathway either moving right or left, or even up or down. Other than such signals, directional words may also be used. For example, you can include first, second, etc., or you can say next, then, etc., to indicate the flow of events. Some charts even include the date of the event to make things even easier.
 Source: EdrawMax Online Edit Now
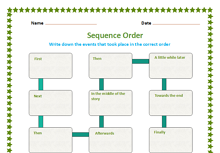
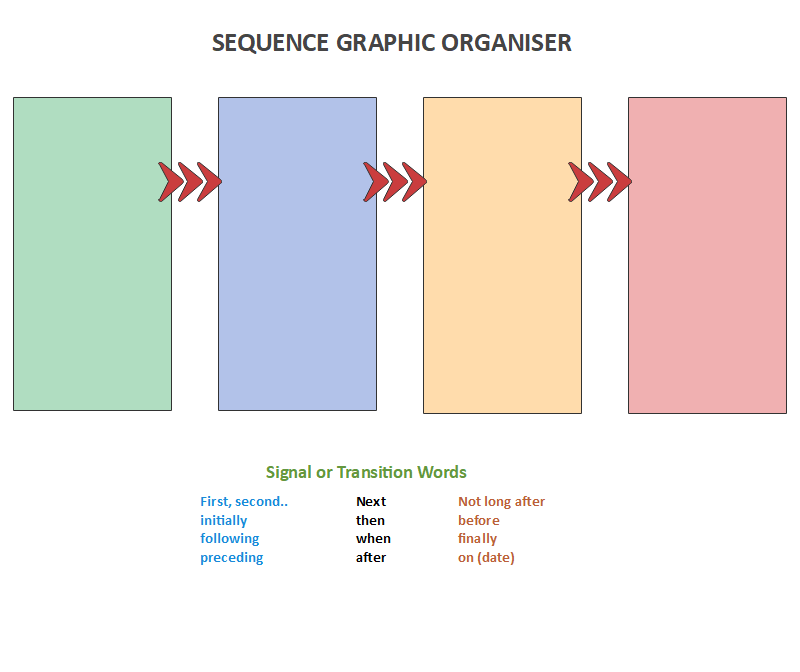
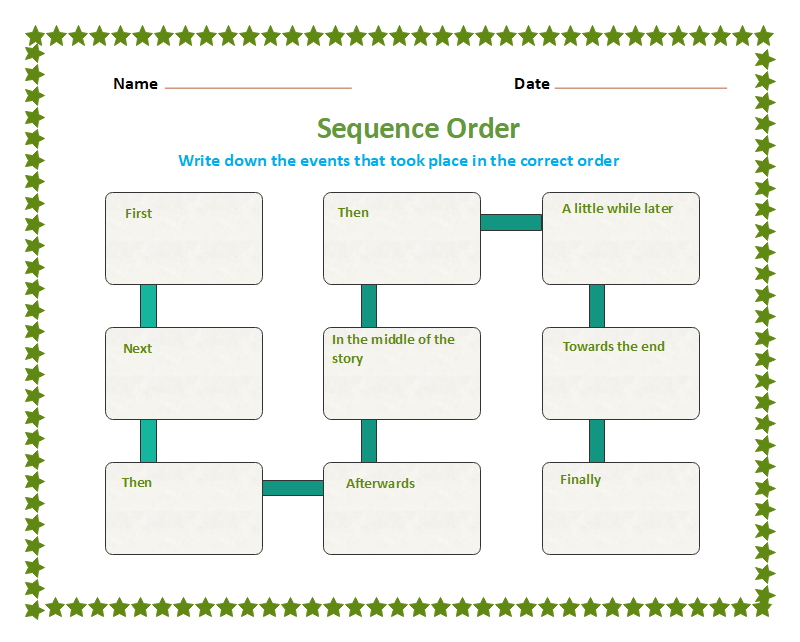
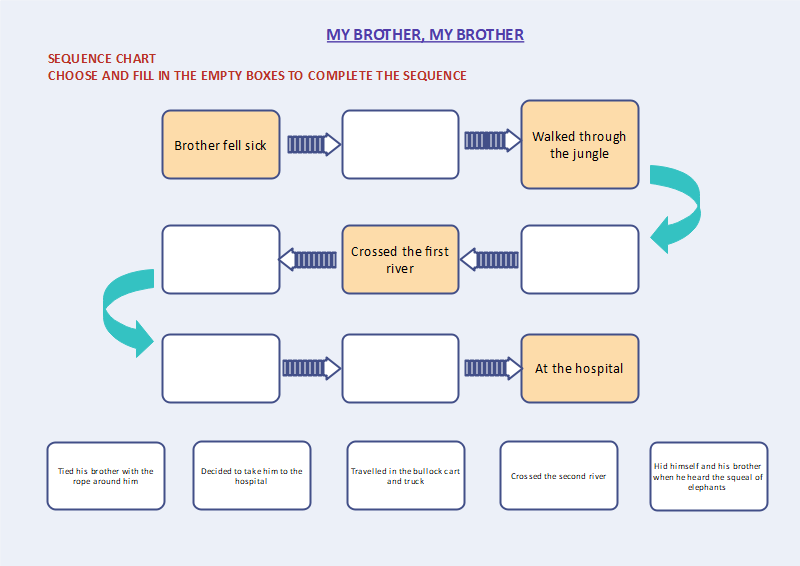
Example 2: Sequence Order Graphic Organizer
Sequence order charts are quite similar to the previous type, sequence graphic organizer. However, they usually can include more information than the previous one. In this type of organizing, you put all the information in boxes of the chart. Then, you put directional lines in between them. You can also use directional symbols to give the same output. As you need to direct the audience from one text or event to another, you must keep the sequential events close so that you can put a connection between them. To make things better, you can also use transitional words, like then, next, first, in the middle, etc., in the text boxes.
 Source: EdrawMax Online Edit Now
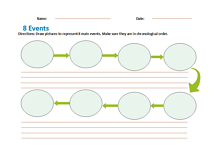
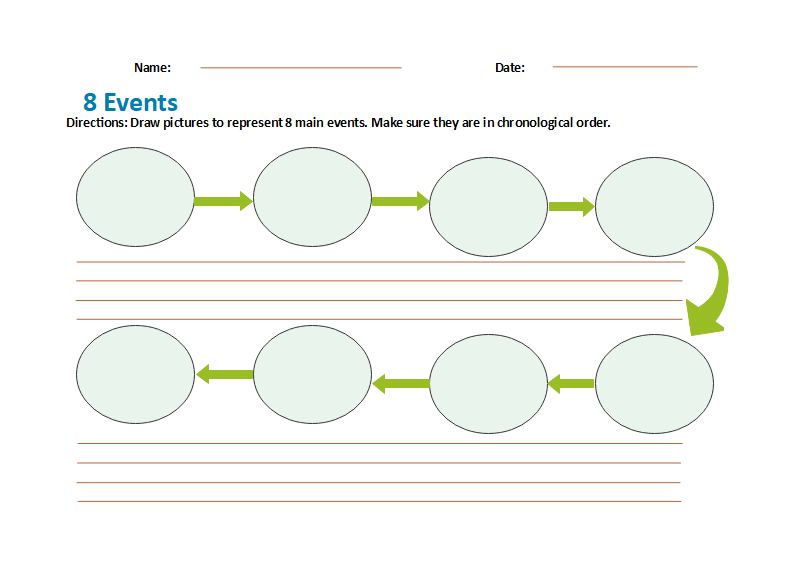
Example 3: 8 Events Sequence Chart
As the name suggests, these types of charts usually include 8 events in one chart. These 8 events are usually put in boxes, which can be of different shapes- oval, circular, rectangular, and so on, based on the type of events. These boxes are then connected via directional symbols. The symbols usually go one way. As these 8 events are usually placed in two rows, the last one of the first row and the same one from the last row are connected through an up or down arrow. The other ones are connected via right and left arrows. As they take a little space to describe 8 events, some charts include their description in between these boxes.
 Source: EdrawMax Online Edit Now
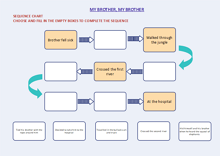
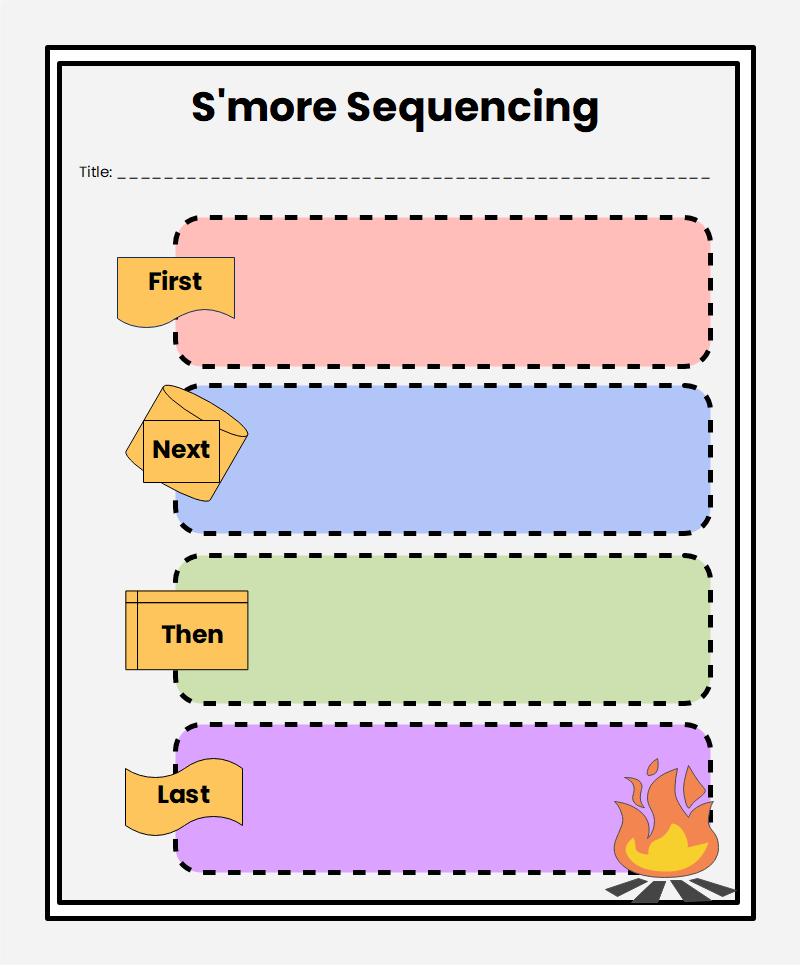
Example 4: Sequence Chart Template
They are somewhat different than the previous types of sequence charts. In previous cases, we found the charts including symbols to denote the direction of the events. However, these charts do not use those directional symbols like the previous ones. Instead, they use transitional words on the upper corner or left of the text boxes. As these boxes do not use symbols, they need to put in the correct order or sequence of events. And to make them look better, you can make these transitional words look different from the other texts. That is why these charts are often called smart charts or smart sequencing.
 Source: EdrawMax Online Edit Now
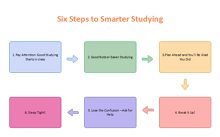
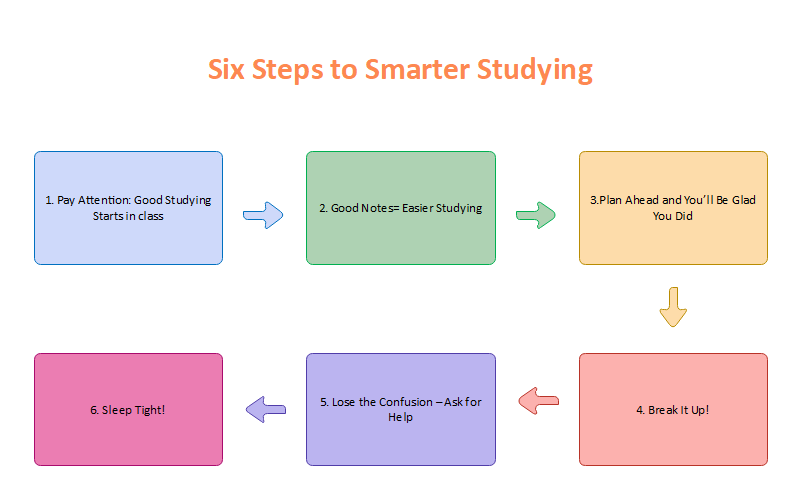
Example 5: Six Step Sequence Graphic Organizer
Just like the previous 8 events sequence chart, this organizer includes 6 steps. As it has fewer steps in it, it is better for educational purposes and breaking down study plans and others. In this type of charts, six steps are presented in two rows, three steps in each. Every steps are presented in each box. The boxes are then connected via directional symbols- right and left for the rows, and down arrow to direct the flow of events from the last box on the upper row to the one at the below. Besides the directional symbols, you can also number the texts to make things easier for the audience.
 Source: EdrawMax Online Edit Now
Example 6: Sequence Chart Example
These sequence charts include more boxes than the previous ones. As a result, you can break down your events in more steps, making things easier. These charts can also be used as educational tools where the teacher or instructor wants to test the students with some kind of flow of information. In these charts, boxes are used as text box and are connected via directional symbols, usually arrows.
 Source: EdrawMax Online Edit Now
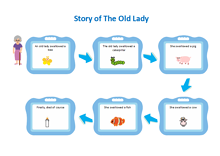
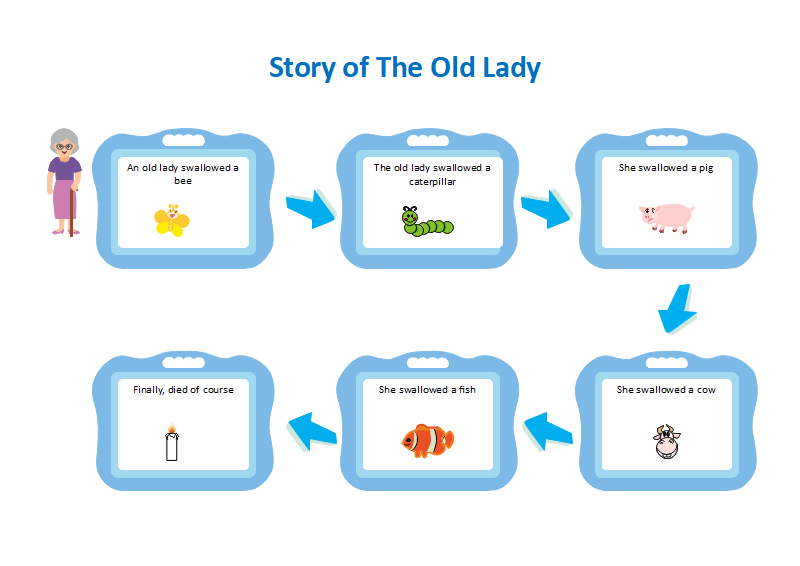
Example 7: Story Sequence Graphic Organizer
As the name suggests, these types of graphic organizers are used to describe a story. Different events of the story are included in each of the boxes. To make things interesting, and as they are graphical presentation, you can always use pictures or similar content to present the story more efficiently. As you use pictures in the boxes, connecting them with directional symbols, like arrows, should be enough. The use of colors and smart tools can take the chart to another level.
 Source: EdrawMax Online Edit Now
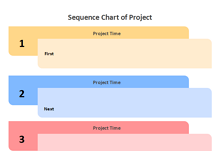
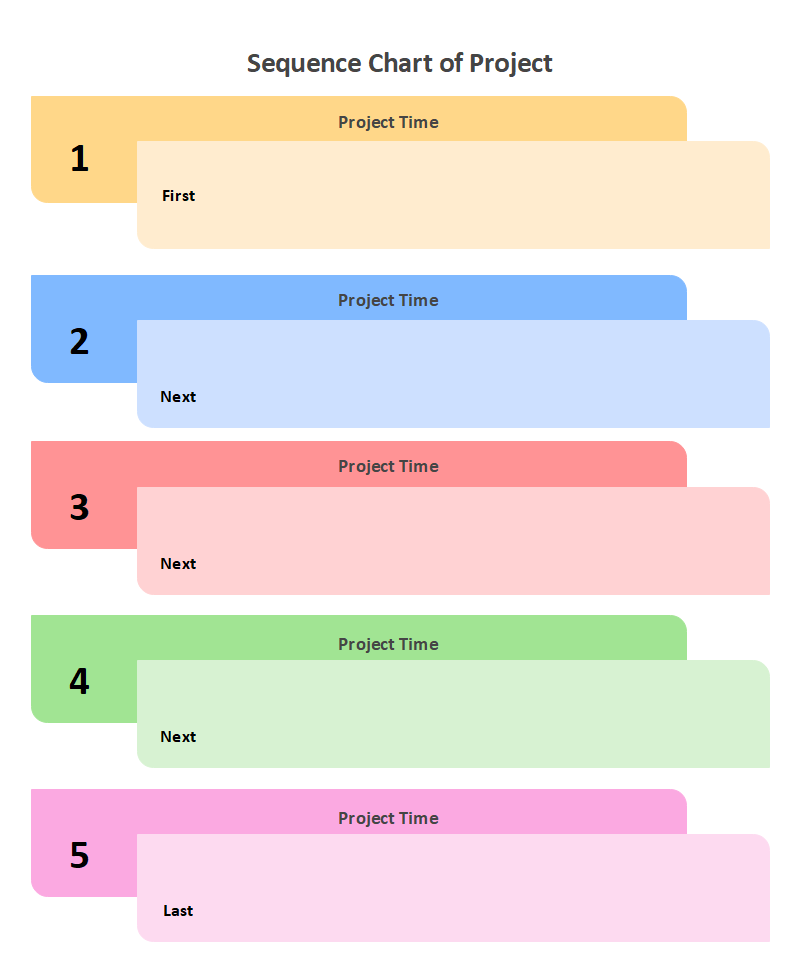
Example 8: Sequence Chart of Project
If you have a number of upcoming projects, you can easily schedule them with the help of this kind of charts. An outstanding advantage of this type of chart is that you can include the time of the event in it. As a result, you get the whole information at the same spot. In the case of a single project, you can easily break down the different events of it with their time in this chart. As the boxes are numbered, there is no need for directional symbols, like arrows.
 Source: EdrawMax Online Edit Now
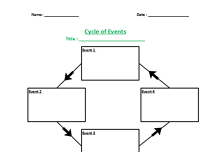
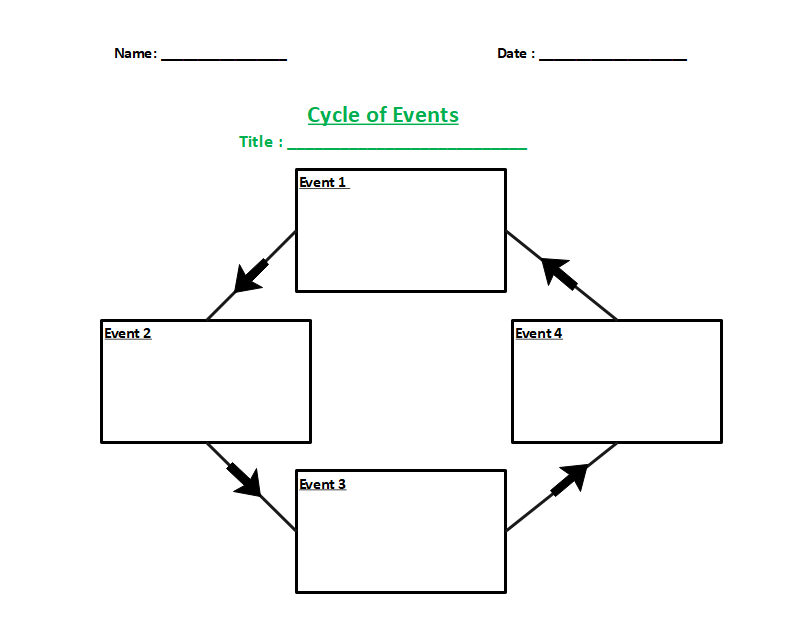
Example 9: Cycle of Events Graphic Organizer
In terms of orientation, this type of sequence graphic organizer greatly varies from the others. While others represent kind of a flow of events, this type of sequence charts represent cycles. The events are connected to each other in it. The last box, i.e., the event, gets connected to the first one and thus completes a cycle. Each of the boxes is numbered as event 1, event 2, and so on. If you want to express lifecycles or other types of cycles, these charts should be on top of your choice.
 Source: EdrawMax Online Edit Now
3. Online Sequence Chart Maker
With the help of online sequence chart makers, you can easily display the logical order of elements or sequential events of some big tasks. Besides, with the help of visualization, you can make your charts worthier. EdrawMax has a collection of pre-designed and customizable templates for drawings. You can also contribute to the template gallery through your diagrams. Symbol libraries are also available for different drawings that can easily be dragged and dropped in the mainframe for easy drawings.
Why Choose EdrawMax Online
- Create over 280 diagram types
- Supports team collaboration
- Personal cloud & data protection
- Print, share and download
- Powerful template community
4. Key Takeaways
A good sequence chart can make your studies easier, teaching efficient, presentations noteworthy, and so on. With the help of the best online chart maker, like EdrawMax Online, you can create all types of graphic organizers, and 280+ other types of diagrams such as flowcharts, UML diagrams, family trees. You can find out more graphic organizer examples in the Template Gallery.
Related Articles


