Sequence Diagram Explained
Create a Sequence Diagram Online Free Free Download Free Download Free Download Free DownloadWhat Is a Sequence Diagram in UML
Sequence diagrams are commonly used by developers to depict interactions between objects in a use case (actions that show interactions between an actor and a system to achieve a goal). Such diagrams typically illustrate how different parts of a system interact with each other, and in what order, to achieve an outcome. They are most commonly used by software developers but have been increasingly adopted within business settings as well, due to its ability to show how a system operates clearly.
How Can a Sequence Diagram Helps You?
So when should sequence diagrams be used, and what can they be used for?
- To illustrate interactions between actors (system users) and the system, or various parts of a system.
- To show the time order in which events occur.
- To be used as a handy form of documentation on how a system functions. This documentation can be passed on to other persons or organizations.
Sequence Diagram Symbols
Now that we have discussed what it is and its purpose, let’s take a look at some commonly used symbols and components in a sequence diagram.
|
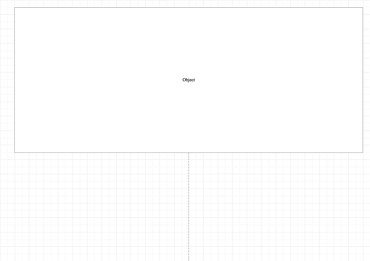
Object Lifeline
Objects or parts of a system that interact during the sequence. |
|
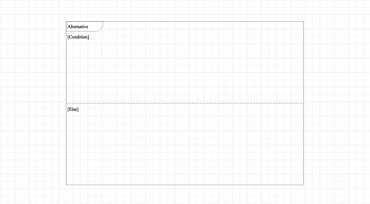
Alternative Fragment
Two or more message sequences exist, and a choice must be made between the two of them. |
|
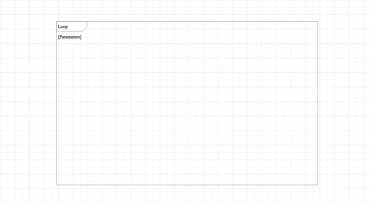
Loop Fragment
Represents a repetitive sequence. |
|
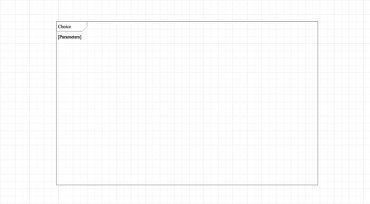
Choice Fragment
A sequence can only occur under certain circumstances. Otherwise, it will fail. |
|
Activation
Represents an active object during an interaction between two objects. The length of the bar represents the duration of an object’s activeness. |
|
Object Deletion
Ends the lifeline of objects or messages. |
|
Actor
Can be a human user or other external subjects. |
|
Entity
Represents system data. |
|
Boundary
Represents software element in a system. |
|
Control
Organizes entity and boundary elements. |
|
Note
Used to contain additional useful information for the modeller/developer. |
|
Message
Sender of the message must wait for the receiver to process the message before continuing to send another message. |
|
Message Return
Receiver of the message passes information back to the sender. |
|
Asynchronous message
Message sender continues sending messages without waiting for the receiver to process its messages. |
|
Self delegation
When an object sends a message to itself. |
|
End point |
How to Draw a Sequence Diagram in EdrawMax?
EdrawMax’s intuitive software allows you to create your sequence diagrams. Follow this outline to create one that fits your needs with minimum effort.
- Step 1: In your browser, visit https://www.edrawmax.com/online/ to access the online version, or download the desktop version at https://www.edrawsoft.com/download-edrawmax.html
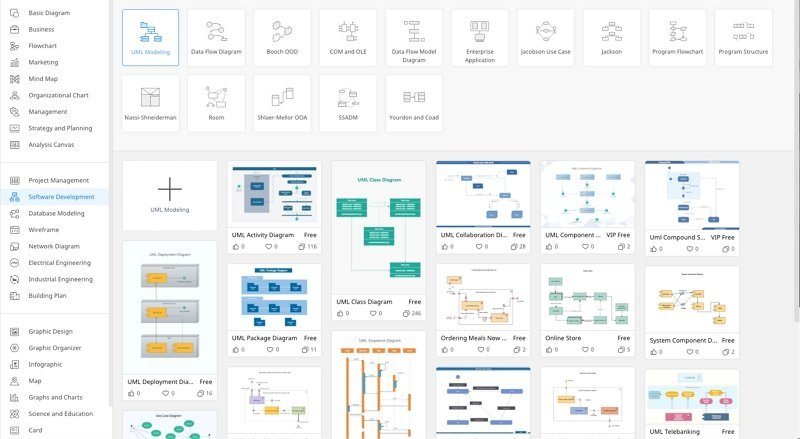
- Step 2: In the white sidebar, click on Software Development. Then, click on the UML Modelling box that appears near the top of the screen.
- Step 3: Choose a template, or click on the UML Modelling box with the “ + ” to open a new document. Alternatively, you may type in “sequence diagram” in the search bar above and use a ready-made template.
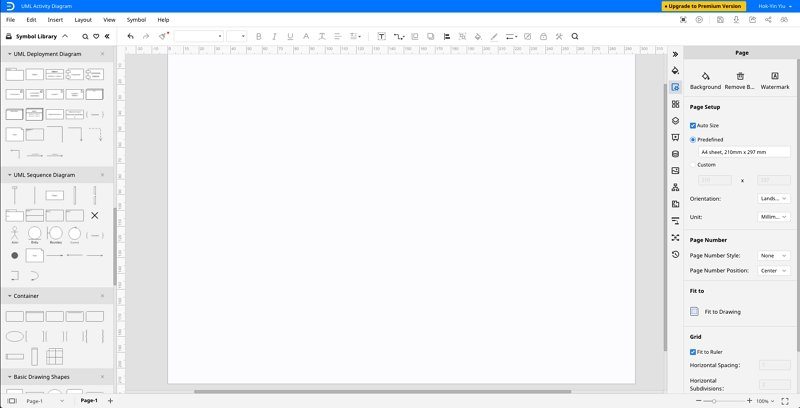
- Step 4: The symbol library can be found to the left of the screen. Scroll down further to find more sequence diagram-related symbols.
- Step 5: Simply drag the components you need from the symbol library onto the blank document to start creating. Each element can be moved, resized, or customized to fit your needs.
Sequence Diagram Examples
Here are examples of sequence diagrams created on EdrawMax.
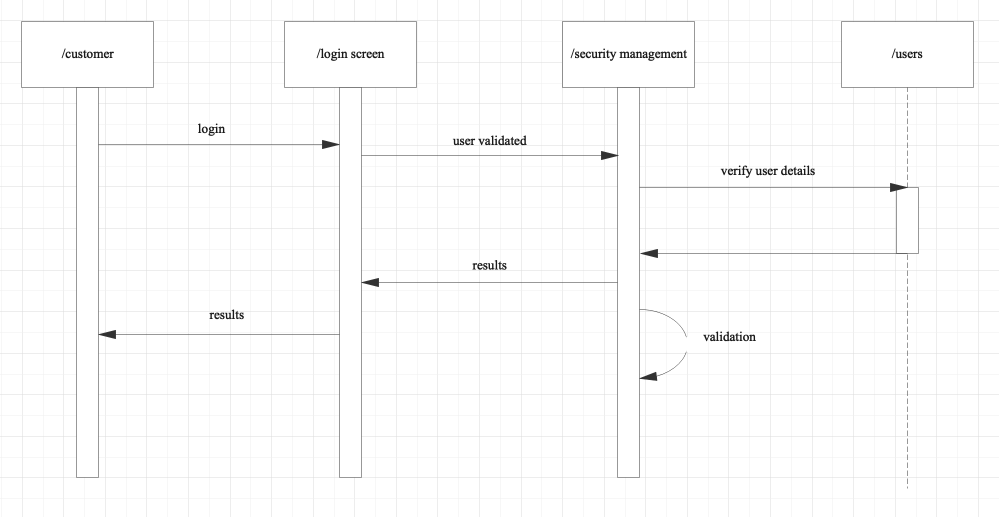
Diagram 1: a customer logging into their online shopping account. This diagram shows what occurs during the verification process.
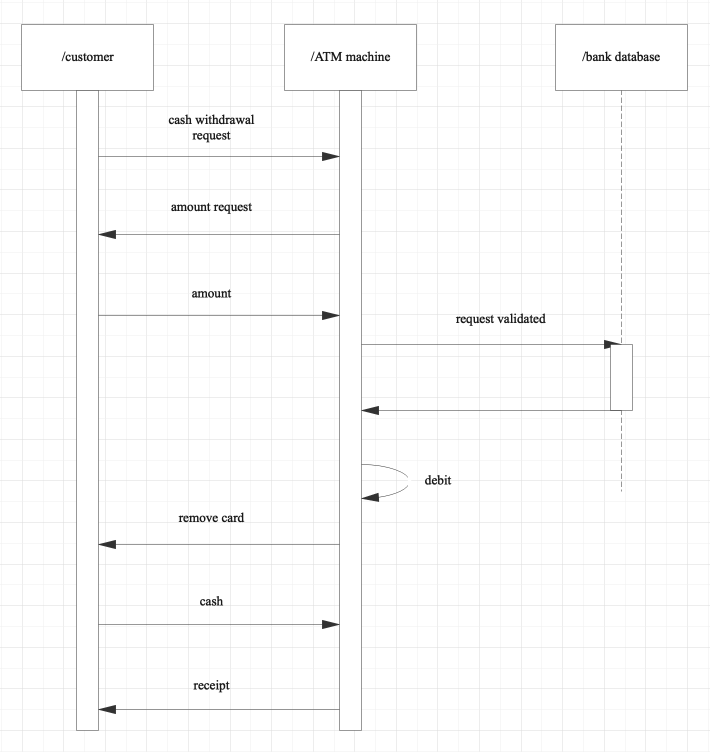
Diagram 2: ATM withdrawal. This diagram shows what interactions occur between the customer, the ATM machine and the bank during a cash withdrawal.
Key Takeaways
In any seemingly simple operation, there are always multiple parts interacting to create a certain outcome. Sequence diagrams are a fantastic way of visualizing and illustrating complex processes, allowing you to break down all of the interactions and see how a system operates on a macro scale. Use Edraw Max’s sequence diagram tools to create your sequence diagrams now!


