Supply and Demand Graph: A Quick Guide
Create a Chart & Graph Online Free Free Download Free Download Free Download Free DownloadWhat is a Demand Curve
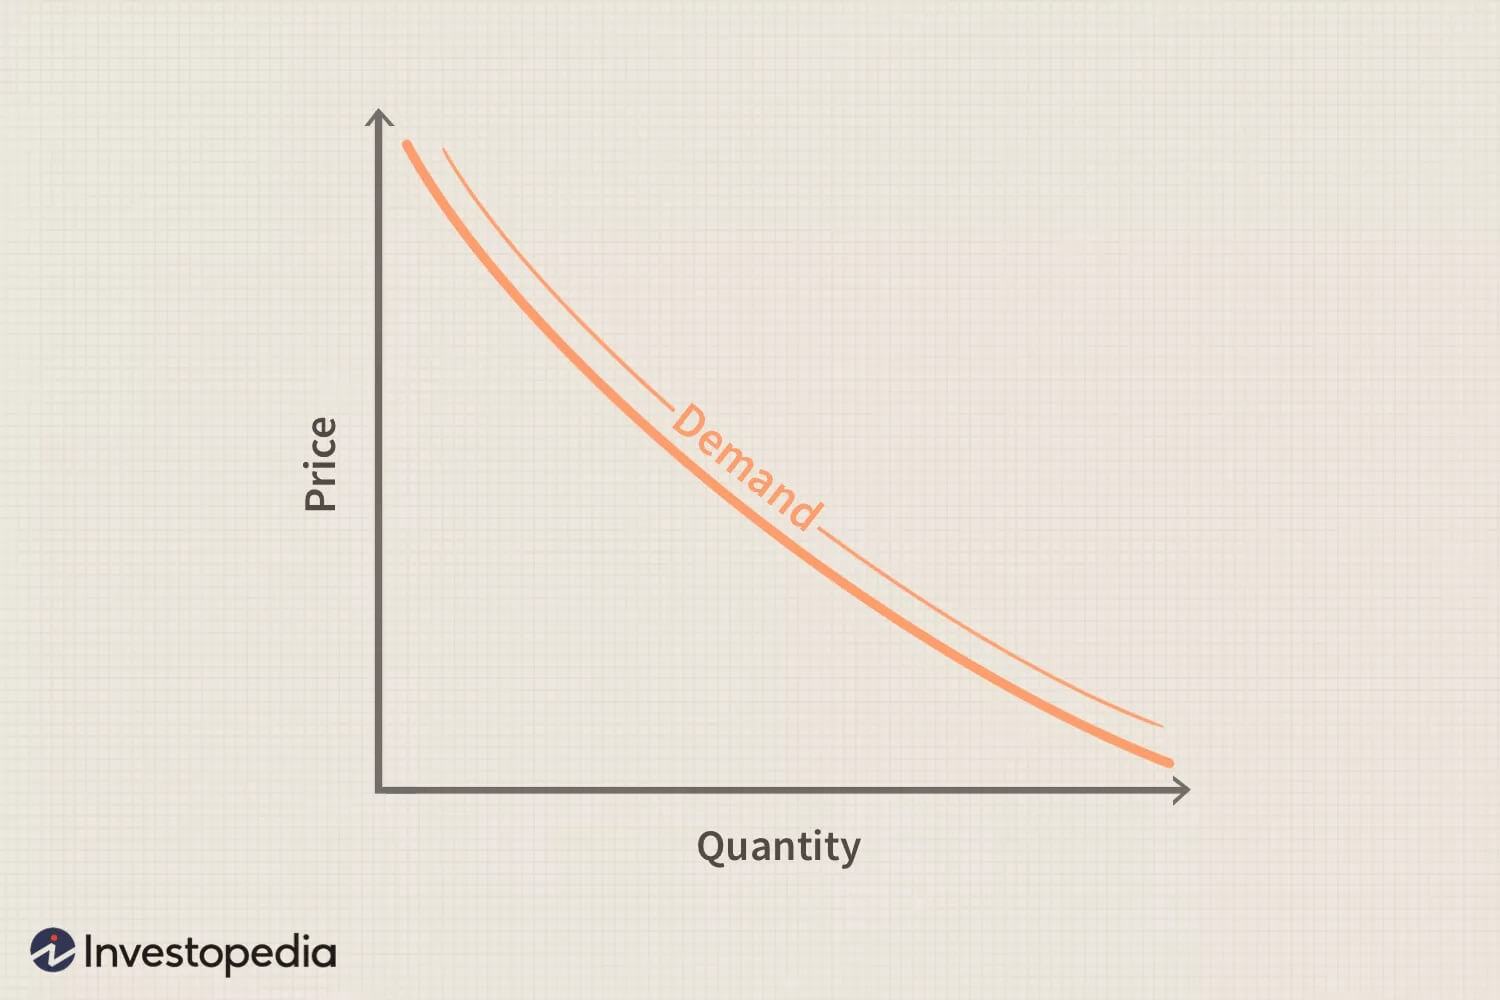
A Demand Curve is a diagrammatic illustration reflecting the price of a product or service and its quantity in demand in the market over a given period. Usually, the demand curve diagram comprises X and Y axis, where the former represents the price of the service or product, and the latter shows the quantity of the said entity in demand.
What is a Supply Curve
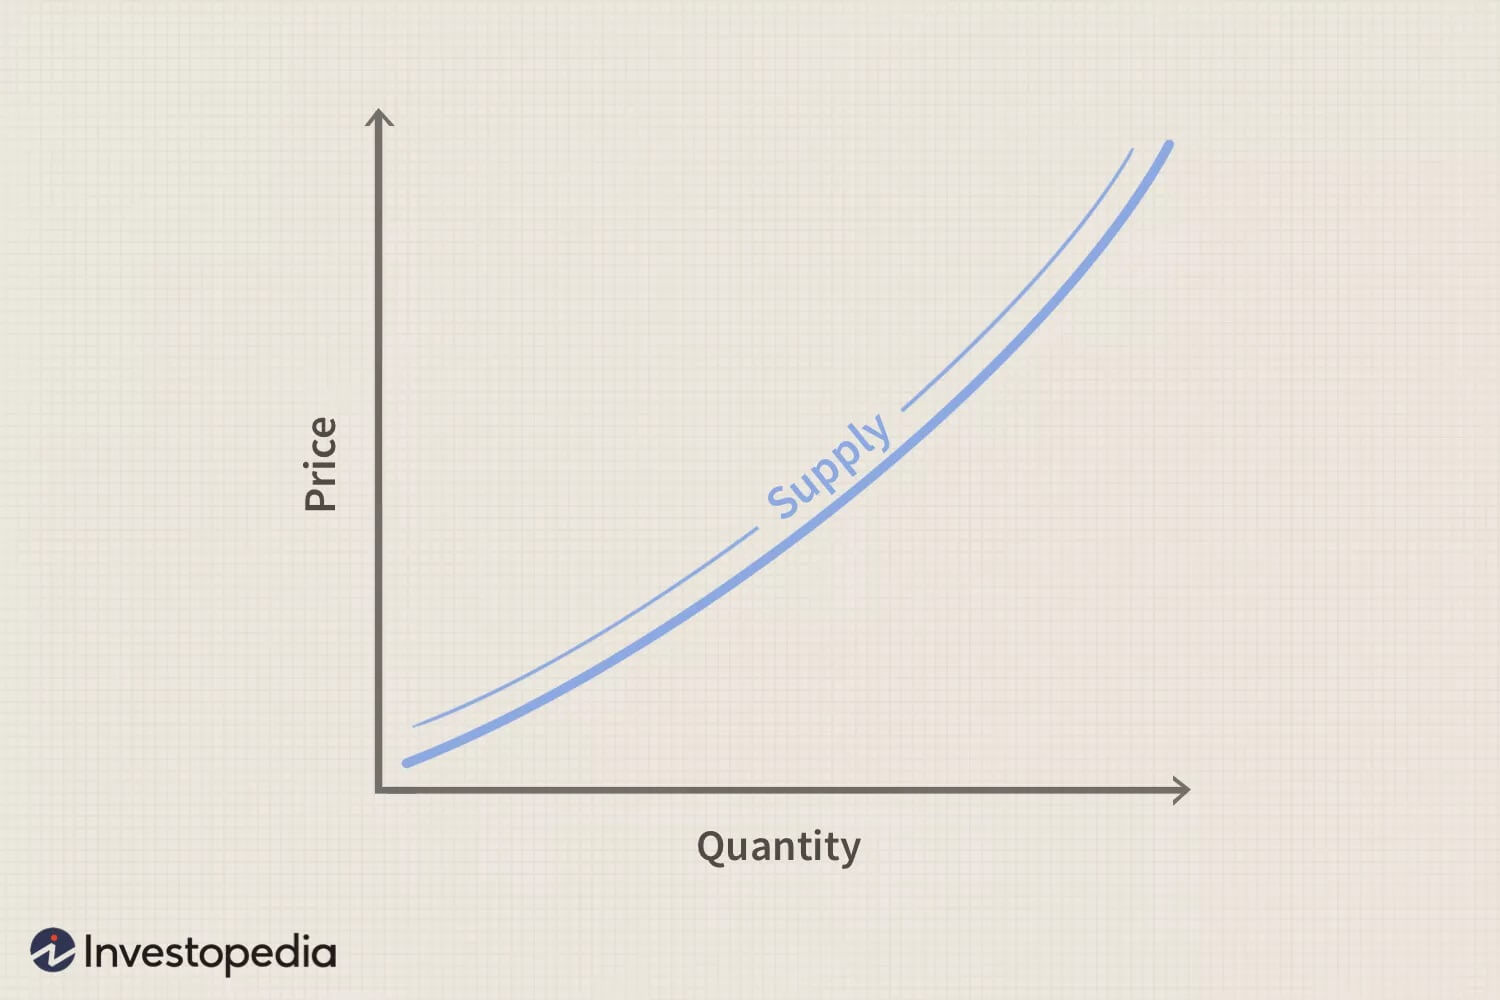
A Supply Curve is a diagrammatic illustration reflecting the relationship between the price of a service or goods and its quantity that has been supplied to the consumers over a specified period. Typically, the Supply Curve comprises X and Y axis, where the former represents the price, and the latter shows the quantity of the product that has been supplied.
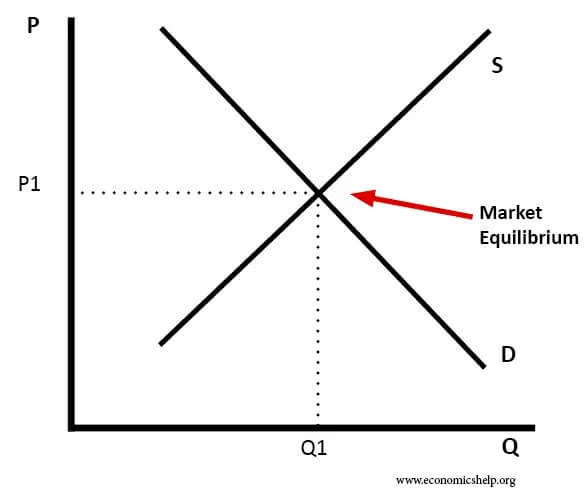
Supply and Demand Graph – Market Equilibrium
Market Equilibrium is a state of a price where the supply of a product or service is equal to its demand in the market. When this happens, the price of the entity remains unchanged changed, and all the transactions flow smoothly.
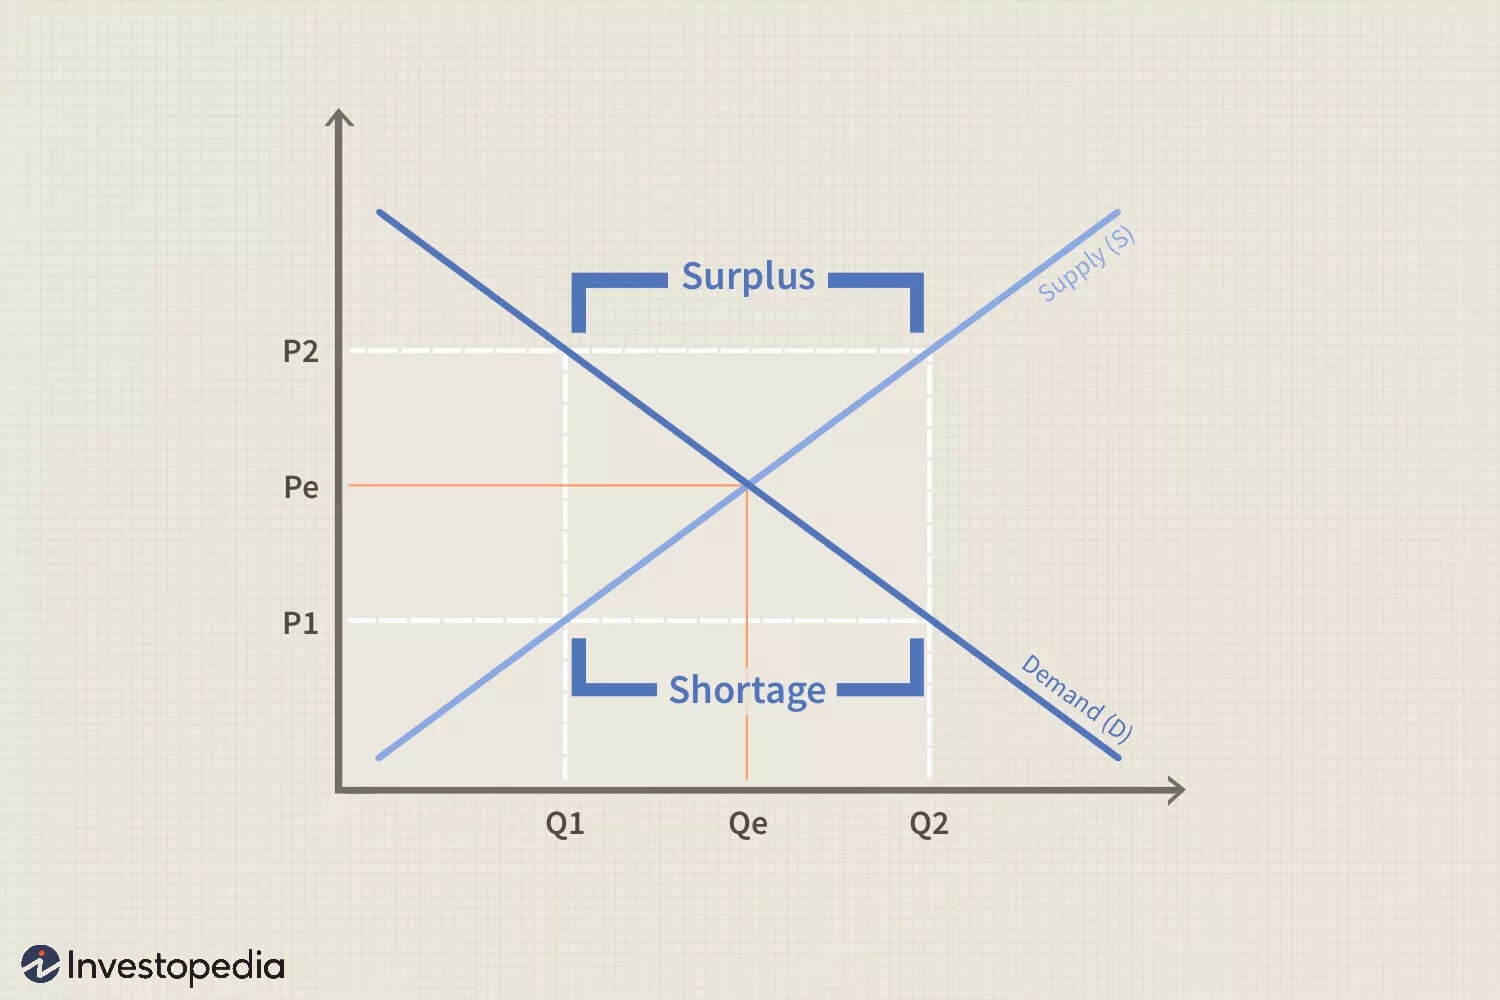
Disequilibrium
The state of Market Disequilibrium is when some imbalances occur either in the demand or supply of the product/service, in which case the sellers increase or decrease the prices accordingly to manage the situation, and to get back to the state of Market Equilibrium that may or may not have the same price as before.
For instance, if there is a sudden increase in demand of hand sanitizers, the supply will be automatically decreased as there would not be enough sanitizers available in the market to meet the demand of the consumers.
In order to manage this situation, the sellers would increase the price of the product. As a result, the number of consumers looking for the disinfectants would reduce, thus reducing the demand, and taking the market back to the state of equilibrium but with different rates.
Likewise, if there is a sudden decrement in the sale of a particular model of a cellphone, this means that the demand has been reduced. This will again cause the state of disequilibrium in the market. In such a scenario, the sellers would reduce the price of the product so as to encourage more people to buy the phone.
With this condition, there will be a time where the market will again reach the state of equilibrium but at the lower cost of the entity.
Some other factors that may cause Market Disequilibrium may include:
- Fluctuation in Sales of Seasonal Goods
- Taxations
- Social Commitments
If an organization manufactures seasonal products such as blankets and keeps the price of the goods constant throughout the year, the demand would be profoundly affected when the weather changes, thus causing disequilibrium.
If an organization tends to stick to its prices for long duration, and the Government makes some amendments in the tax percentage, the market reaches the state of disequilibrium.
If a company has a long-term commitment with its consumers about the prices being the same, or the customers are used to buying the product at the same rate for a long period, the market disequilibrium occurs.
As you can notice, market disequilibrium happens when the prices remain constant for a long duration. In such cases, the sellers must make required adjustments in the rates of their goods to manage proper balance, so as to get the supply and demand graph right.
Price Elasticity
In simple words, the effect on demand for a particular product due to any variation in its price is called Price Elasticity. In this context, the products or services can be divided into two categories:
Elastic Product
Any product whose supply and demand graph varies significantly due to any change in price is called an Elastic Product.
Inelastic Product
Any product that causes less or no changes in the supply and demand graph is referred to as an Inelastic Product.
A thorough market survey is required to assess and draw a supply curve and a demand curve for a product or service that an organization deals in. Once the survey is done, there are several tools available online that can help you create a supply and demand graph with efficiency and perfection.
If you want to learn how to create a supply and demand graph, there are numerous tutorials and step-by-step guides to guide you through on that as well.
A supply and demand graph is pretty helpful as it clearly illustrates the then-current state of Market Equilibrium or Market Disequilibrium, and enables you to take correct and timely decisions accordingly. That said, regardless of the scale of your organization, it is imperative to create supply and demand graph to get a clear picture of the market, and come up with an effective solution as per the nature of the product/service, i.e. elastic or inelastic.


