20+ Free Editable Venn Diagram Examples
Venn diagrams are one of the most accessible graphical representations. School courses include Venn diagrams as it has the potential of simplifying things. The users can easily discuss and analyze simple or complex theoretical relationships between two components. The relationship can be ideas based as well. Various fields like marketing, research, psychology, and science use Venn diagrams for a straightforward approach to complicated topics. There are a variety of Venn diagram examples based on their extensive usage.
1. What is A Venn Diagram
A Venn diagram is the graphical representation of relations between various elements or components of a particular concept or scenario. It helps an individual to analyze the relationship between those elements. Different subjects like maths, statistics use Venn diagrams to explore the relationship between the components.
In a Venn diagram, the relationship can be theoretical or ideas. It helps with the analysis of different complex concepts. The periphery of the Venn diagrams is now no more restricted to math and other related subjects. They have become useful for studies, data, even sorting life goals. With the following Venn diagram examples, you may understand and create Venn diagram easier.
2. The Venn Diagram Examples
There are various sorts of Venn diagrams, and the user can plan their Venn diagrams based on the elements they need to work on for their project. Here are some Venn diagram examples that the users can refer to while designing their own.
 |
 |
 |
| Three Circle Venn Diagram | Venn Diagram Math | Probability Venn Diagram |
 |
 |
 |
| Funny Venn Diagram | Purpose Venn Diagram | A U B Venn Diagram |
 |
 |
 |
| Venn Diagram Formula | Venn Diagram for Kids | Five Circle Venn Diagram |
 |
 |
 |
| Social Networking Venn | Corporation Culture Venn | Business Venn Diagram |
 |
 |
 |
| Human VS Owl Eyes | Essay Topics Venn | Market Research Venn |
 |
 |
 |
| Animals and Plants | Customer Satisfaction | Realistic VS Historical Fictions |
 |
 |
 |
| Qualitative and Quantitative Methodology | Formative VS Summative Assessments | Coherence and Cohesion |
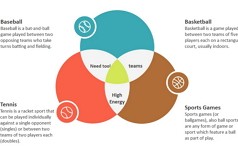
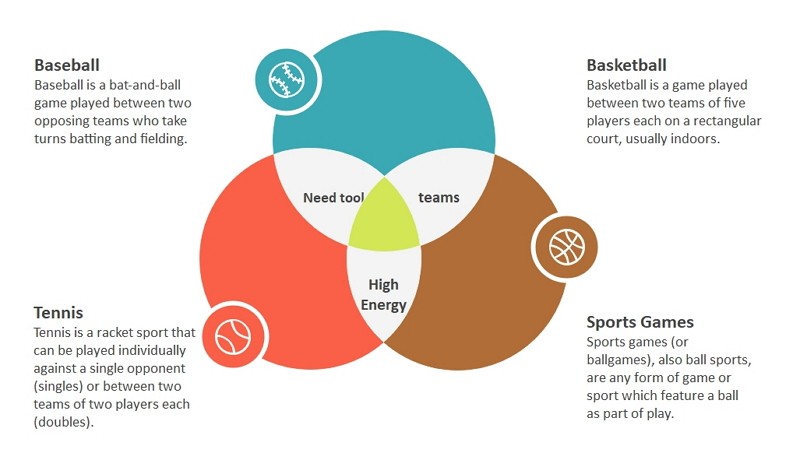
Example 1: Three Circle Venn Diagram
This example shows the three circle venn diagram, and from which it is clearly to see the relationships among three sets, and the intersections. From this Venn diagram, the sports game has been classified by the tools, teams, and high energy. A 3-circle Venn diagram, named after the English logician Robert Venn, is a diagram that shows how the elements of three sets are related using three overlapping circles.
 Source:EdrawMax Online
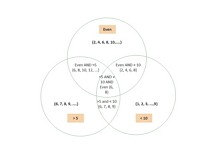
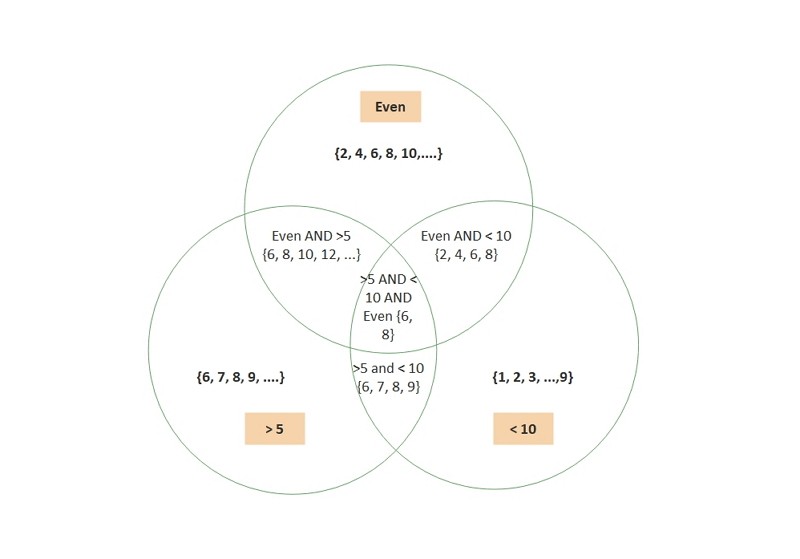
Example 2: Venn Diagram Math
In this case, the two circles representing positive integers that are greater than 5 and positive integers that are less than 10 have an overlapping region that represents the set of positive integers that are both greater than 5 and less than 10—in other words, the set { 6, 7, 8, 9 }.
 Source:EdrawMax Online
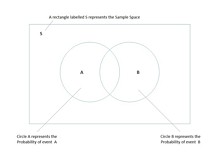
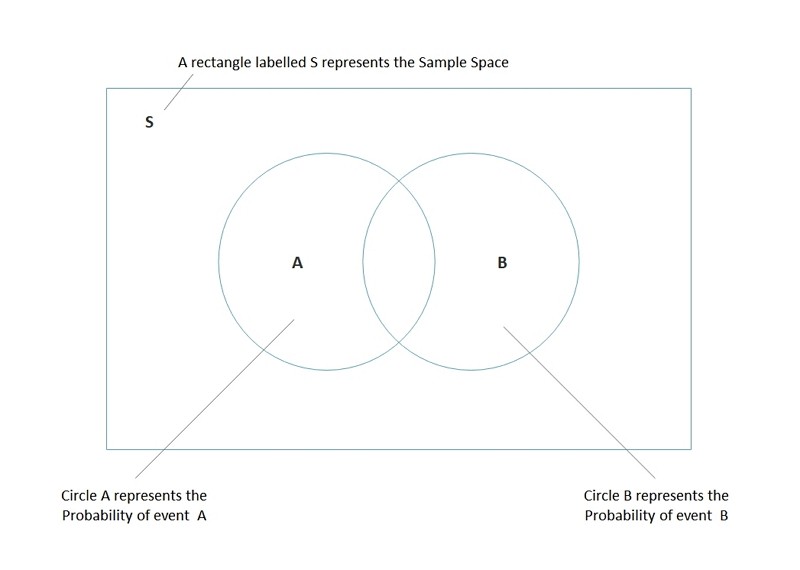
Example 3: Probability Venn Diagram
The Venn diagram not only can represent the relations between two or more sets, but also can show the probability. Probability is a repeatable process that gives outcomes, an event to show the collection of one or more outcomes, and a sample space to show all the possible results. As this Venn diagram shows, the circle A represents the Probability of event A, circle B shows the Probability of event B, and S represents the Sample Space.
 Source:EdrawMax Online
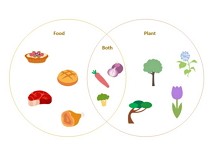
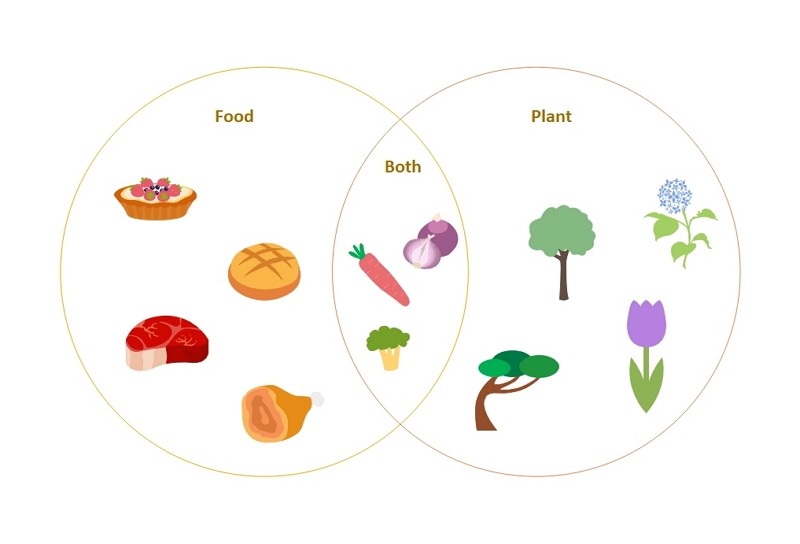
Example 4: Funny Venn Diagram
Check this funny Venn diagram, which used the cute icons to represents the elements in our daily life, and the classfication for foods and plants. In this example, the foods are breads, meat, and ham. In contrast, the plants are trees, flowers. However, as for the intersection between foods and plants are some vegetables, like onion, broccoli, carrot, and more.
 Source:EdrawMax Online
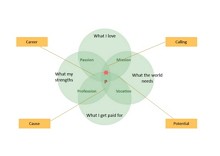
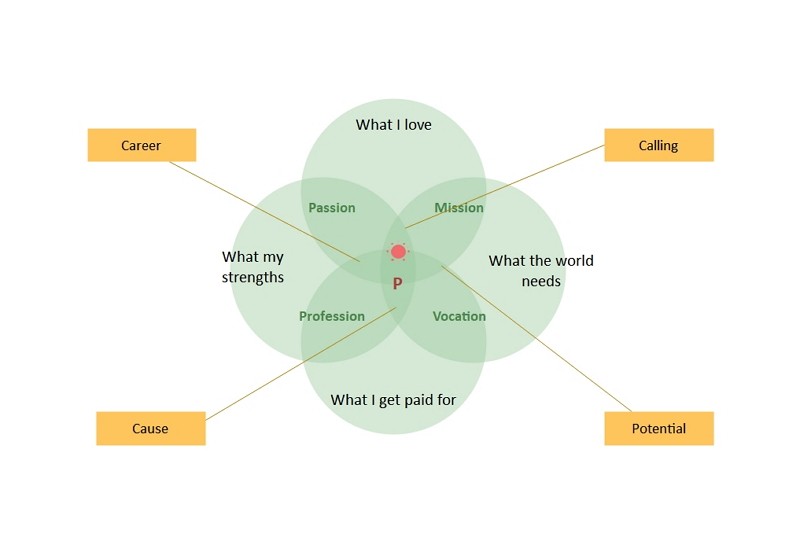
Example 5: Purpose Venn Diagram
The purpose Venn diagram is a simplified view of the current work situation. It provides us with a starting point to think about whether we might miss an aspect of our current work and what that aspect might be. Purpose Venn diagram can help us create a more balanced work environment.
 Source:EdrawMax Online
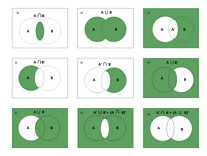
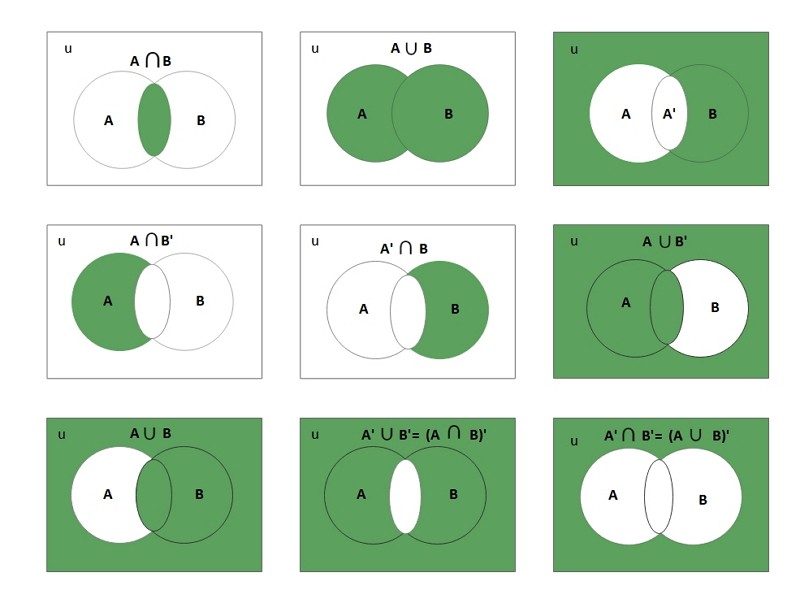
Example 6: A U B Venn Diagram
The Venn diagram is a visual representation of the reletions between or among sets. The diagram below shows the different relationships for two sets. A intersect B, A union B, A', A intersect B', A' intersect B, A union B', A' union B, A' union B' = (A intersect B)', A' intersect B' = (A union B)'. For more details, you can check this Venn diagram.
 Source:EdrawMax Online
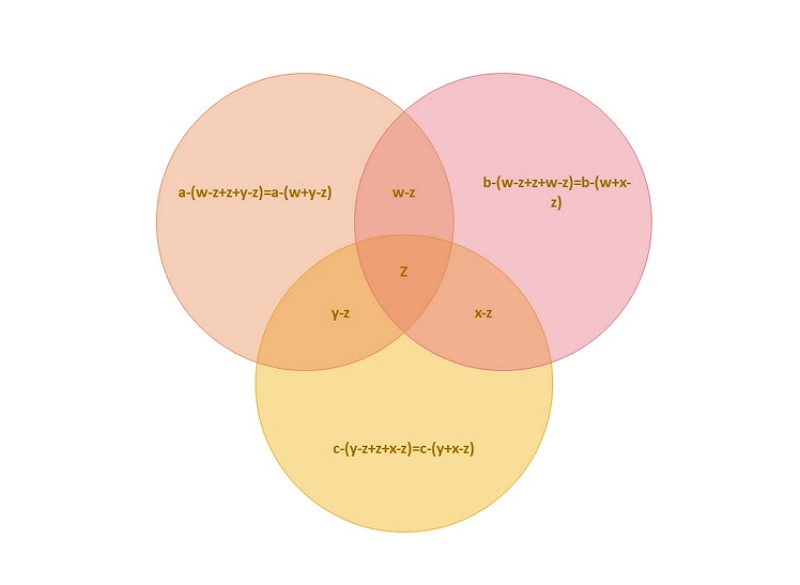
Example 7: Venn Diagram Formula
Here is an Venn diagram applied in math formula. If these three circles are A, B, and C. From this Venn diagram, we can see the numbers related only to A is a-(w+y-z), B is equal to b-(w+x-z), C is c-(y+x-z). Then, as for the elements related to (A and B) is w-z, (B and C) is x-z, (A and C) is equal to y-z, all three sets is equal to z. So, the formula for all three sets is [a-(w+y-z)]+[b-(w+x-z)]+[c-(y+x-z)]+(w-z)+(x-z)+(y-z)+z. Following this formula, the results for this kind of math problems will be easy to get.
 Source:EdrawMax Online
Example 8: Venn Diagram for Kids
The given example of the Venn diagram showing the animals' classfications by the place where they live. On the earth, there are animals, like mammals, birds, insects, and more are lived on the land. On the contrary, some are live in water, such as fish, coral, and others. However, there are animals can live between land and water, due to their body specaility, like duck, penguine, turtul, frog, and etc. This venn diagram is for kids and let them know the diversity of this world.
 Source:EdrawMax Online
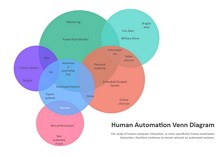
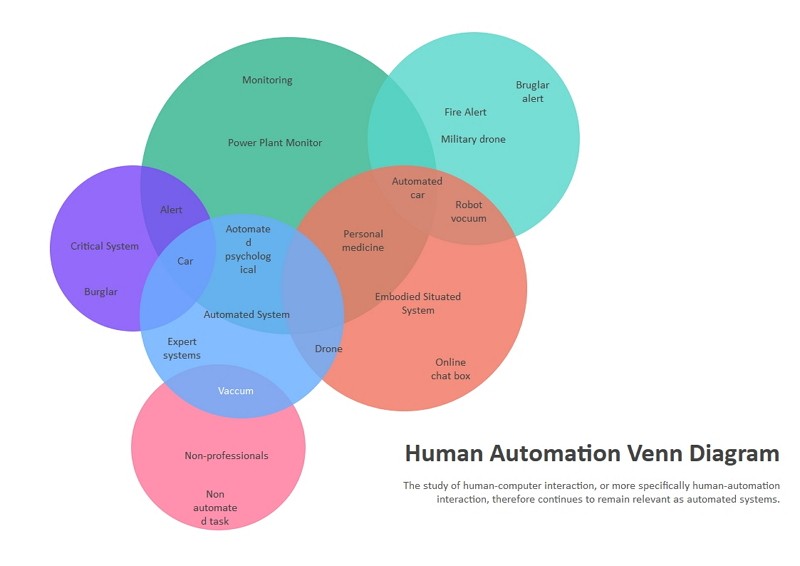
Example 9: Five Circles Venn Diagram
Venn diagram is usually used for compare the differences and similarities, and the five circle venn diagram is the for showing the differences and similarities of human automation. The study of human-computer interaction, or more specifically human-automation interaction, therefore continues to remain relevant as automated systems.
 Source:EdrawMax Online
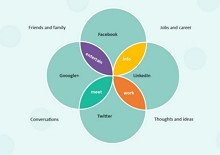
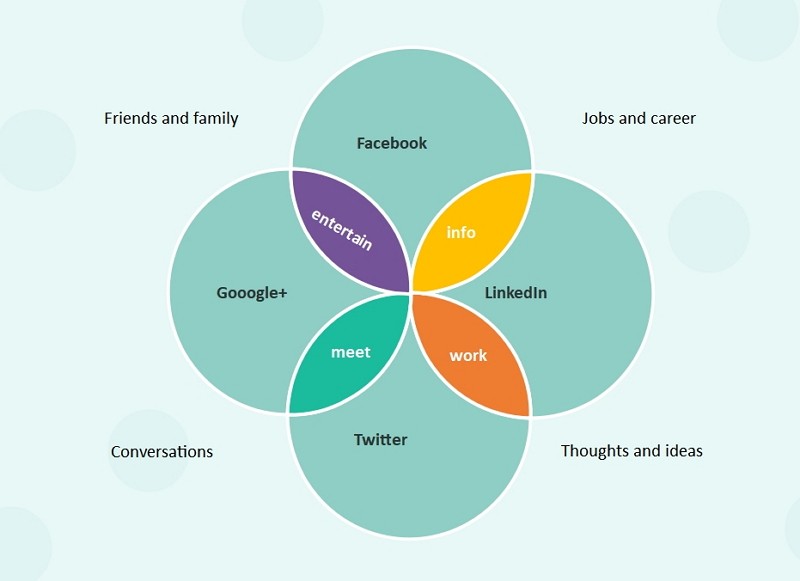
Example 10: Social Networking Venn Diagram
The given example of the Venn diagram shows how for social media, their function gets overlapped. A Venn diagram shows the interrelationship between the elements present in social media. There are specific differences between the Venn diagram and the Euler diagram. Here the diagram shows Facebook and Google+ both have a similar function: entertainment and involves friends and families. The example spots the similarity in functions of Facebook, Twitter, LinkedIn, and Google+.
 Source:EdrawMax Online
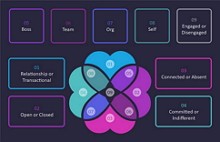
Example 11: Corporation Culture Venn Diagram
The mentioned example analyses the relationship of various elements present in the corporate culture. The corporate houses have to deal with the team, boss, and individual employees who have connections with the strategies, commitments, aims. Their engagement to the work, absence, connection, and more, contribute to their performance. The Venn diagram clarifies how the link works. The designer working on a Venn diagram on corporation culture can take it as an example and modify it as per their requirements.
 Source:EdrawMax Online
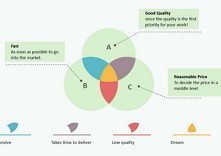
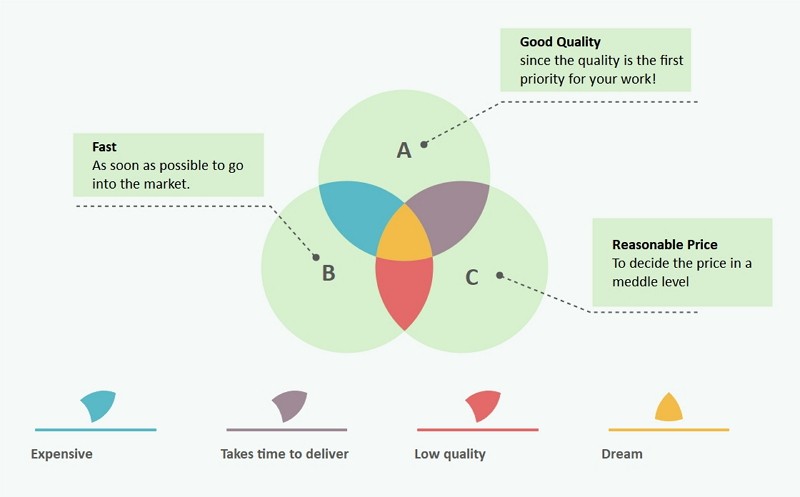
Example 12: Business Venn Diagram
Here is an example of a Venn diagram that shows how it works in a business. Various affordable price ranges, quality, and fast market penetration lead to a business organization's dream goal. The Venn diagram also shows that factors like inferior quality, delay in delivery, or high expenses can cause a decrease in sales. This administrator can use this model for developing their own.
 Source:EdrawMax Online
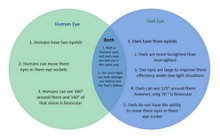
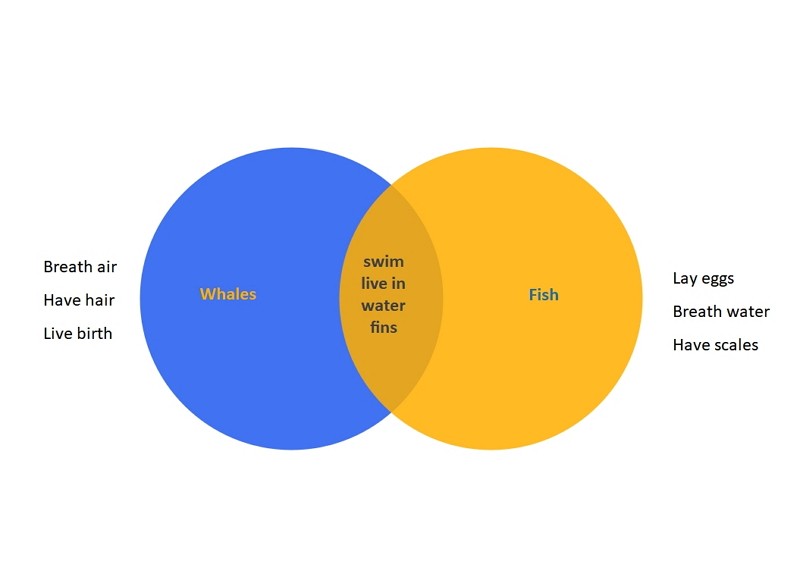
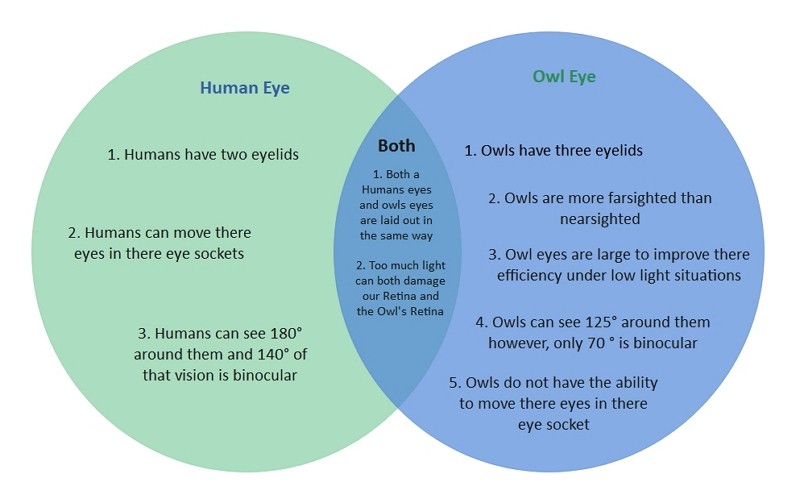
Example 13: Human VS Owl Eyes Venn Diagram
There are specific Venn diagram structures that the teachers and students can use in school. These Venn diagrams can also simplify the subject topics and make it easier for learning. For example, the Venn diagram shows the similarities and dissimilarities between the human eyes and owl eyes. The Venn diagram has two distinct regions that show their features, while the overlapping middle part shows their common traits.
 Source:EdrawMax Online
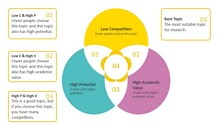
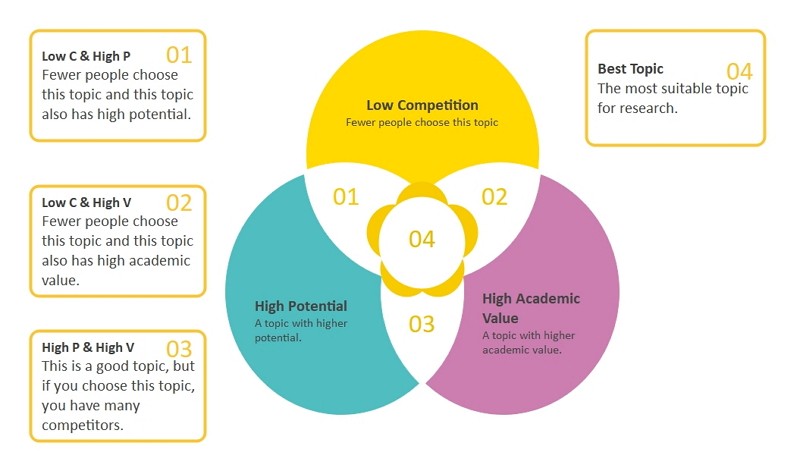
Example 14: Essay Topics Venn Diagram
When individuals select a topic for their research paper, they must consider certain sides of the particular subject. For essays, the elements that affect the score are competition, potential, and value. When students are short-listing, they can put their topics in their circles, denoting competition, potential, and value. The three circles' overlapping part indicates the best issue with all the qualities like value, potential, and competition.
 Source:EdrawMax Online
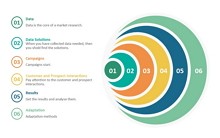
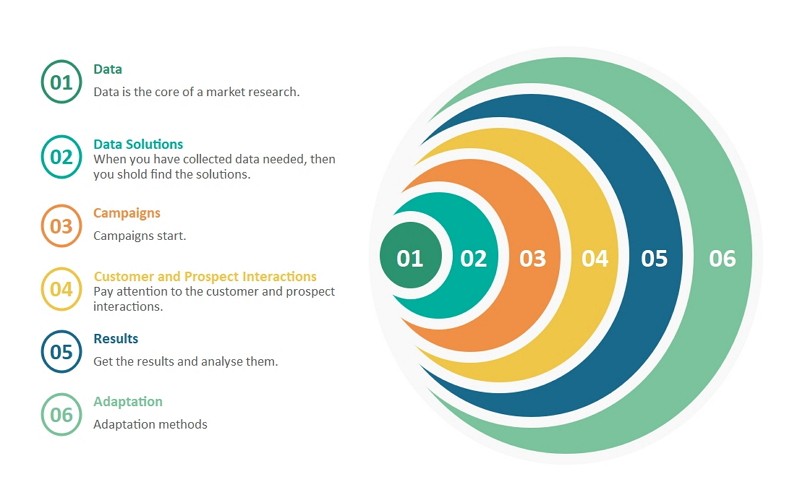
Example 15: Market Research Venn Diagram
The given Venn diagram example shows the interrelationship between various factors of market research. The different market research elements, including the data, solutions, promotional campaigns, consumer feedback, adaptation, and other things, have interconnection, and the sale of a product depends on them. The designer working on a business research Venn diagram can add separate other market research parameters based on their data.
 Source:EdrawMax Online
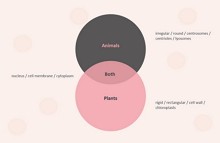
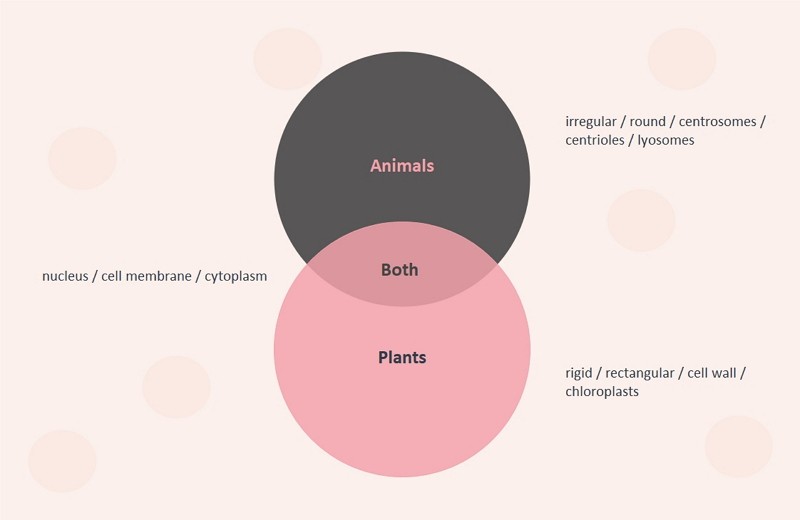
Example 16: Animals and Plants
Venn diagram explains the complex relationship between two various elements. It allows the user to have a better understanding of the dynamics of the components of the diagram. The Venn diagram example shows how the two various elements like animals and plants exist, and they have some relation or standard features. Similarly, the user can include more aspects in the Venn diagram to show the relationship between two or more elements. They can modify the example as per their requirements.
 Source:EdrawMax Online
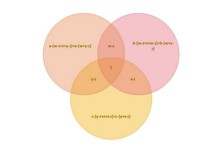
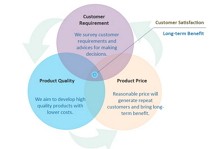
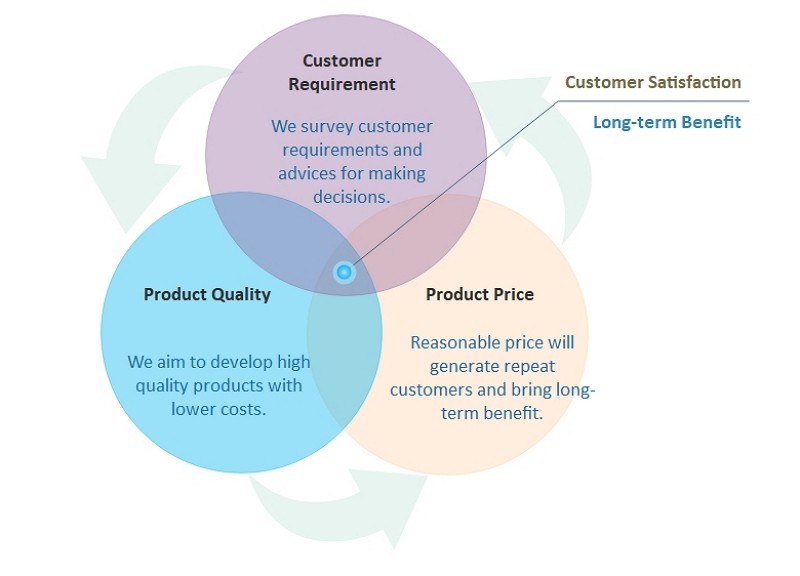
Example 17: Customer Satisfaction Venn Diagram
A customer satisfaction Venn diagram is an illustration that uses circles to show the relationships among things or finite groups of items. Customer satisfaction Venn diagram shows the relationship between customer requirement, product quality, and product price. As the customer satisfaction, Venn diagram suggests, customer requirement is advice taken to make better decisions; product quality is when a company aims to develop high-quality products with lower costs. Product price is reasonable price will generate repeat customers and bring long-term benefit—the area where all these three joins get complete customer satisfaction.
 Source:EdrawMax Online
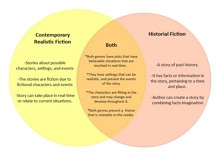
Example 18: Realistic VS Historical Fictions
Here is a Venn diagram regarding compare and contrasting realistic and historical fiction. Venn diagrams depict complex and theoretical relationships and ideas for a better and easier understanding. These diagrams are also professionally utilized to display complex mathematical concepts by professors, classification in science, and develop sales strategies in the business industry.
 Source:EdrawMax Online
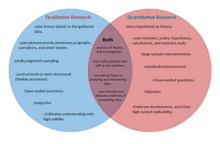
Example 19: Qualitative and Quantitative Methodology
Here is a Venn diagram about the qualitative and quantitative methodologies. Qualitative research methods usually involve first-hand observation, such as interviews or focus groups. Quantitative research methods such as surveys and questionnaires will equip researchers with knowledge of what the situation is.
 Source:EdrawMax Online
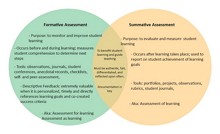
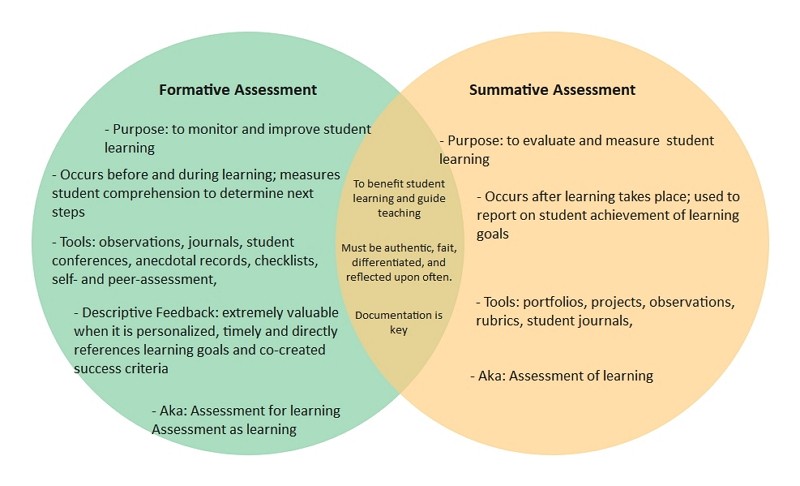
Example 20: Formative VS Summative Assessments
Here is a Venn diagram of formative vs. summative assessment. The purpose of formative assessment is to monitor student learning and provide ongoing feedback to staff and students. The goal of summative assessment is to evaluate student learning at the end of an instructional unit by comparing it against some standard or benchmark.
 Source:EdrawMax Online
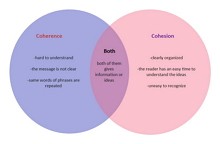
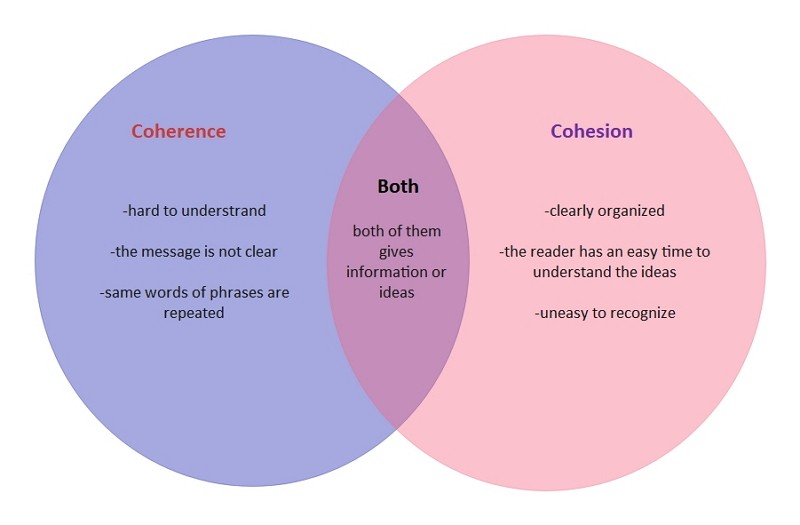
Example 21: Coherence and Cohesion
Here is a Venn diagram compared to the coherence and cohesion in English grammar. As for their similarities, they are all giving information or ideas. But the differences are their understanding and the clearance of the message.
 Source:EdrawMax Online
3. Online Venn Diagram Maker
Venn Diagrams are elementary to make, but various elements and representation methods make it sound not very easy. Various online tools can make it easy for a user to work on their diagram maker. They can use tools like EdrawMax Online for the best results. The tool comes with templates and symbols which allow the newbie user to work on a Venn diagram. They can also contact the resource center for guidance.
EdrawMax Online not just an online Venn diagram maker. Use EdrawMax online to create your Venn diagrams without efforts, just grab a template or choose one Venn diagram template from EdrawMax Template Gallery and keep customization as your preference.
Why Choose EdrawMax Online
- Create over 280 diagram types
- Supports team collaboration
- Personal cloud & data protection
- Print, share and download
- Powerful template community
4. Key Takeaways
Venn diagrams are instrumental pictorial representations of the connection between two or more elements. Various fields like logic, marketing use Venn diagrams to analyze their complex concepts. Individuals can also use a Venn diagram to sort their life goals. They can use online tools like EdrawMax Online to work on their Venn diagram. Also, there is Venn diagrm guide for you to make diagrams in minutes.
In conclusion, EdrawMax Online is a quick-start diagramming tool, which is easier to make Venn diagrams and any other visuals. Also, it contains substantial built-in templates that you can use for free, or share your Venn diagrams with others in our template community.


