How to Create a Bubble Chart on Google Sheets
1. How to Create a Bubble Chart in Google Sheets
Data visualization is a necessary technique. It helps with analyzing, displaying, and comparing data. A bubble chart allows you to represent multiple sets of enormous data with three or more dimensions. It is a collection of different disk-shaped diagrams.
A bubble chart is a form of a chart that lets you see three variables in a dataset. On a scatter plot, (x, y) coordinates represent the first two variables, while the third represents size. Here is a step-by-step guide that will show you how to create a bubble chart in Google Sheets.
Step 1: Opening Google Sheets
You may access Google Sheets by signing into your Google account with your Gmail ID. In your home browser window's far-right corner, you'll observe nine dots in a square pattern. To continue, click on the dots, click on the sheets and choose a blank sheet.
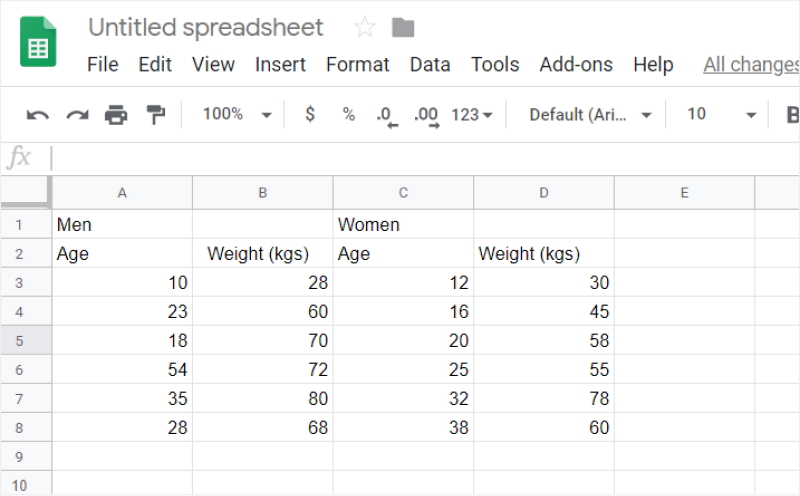
Step 2: Insert the Required Data
You may manually enter data into a Bubble Chart or copy and paste it from a desktop document. You may also import your data by clicking Import from the File Tab. However, we'll be using manually entered sample data for this tutorial.
Step 3: Placing the Chart
Now edit your SmartArt Graphic and insert your Bubble Chart ppt points. After completing the process, you click the 'OK' button, and there you get your decision-making flowchart.
A compelling illustration of the decision-making algorithm with the help of the Bubble Chart would enable you to make decisions quickly and effectively. Using the PowerPoint illustrated above will help you create the chart without much effort. Once you get started, you will find that making the chart with PowerPoint is a simple yet impactful illustration.
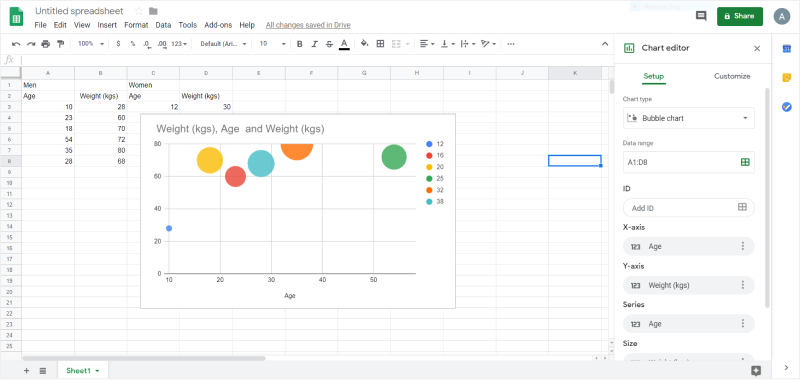
Step 4: Selecting the Appropriate Bubble Chart
Double-click the chart to convert the bar graphs to a bubble chart. A chart editor will be there on the right side of the screen. Go to the Set-up tab and select Chart Type from the drop-down arrow. Select the second option, Bubble, from the Scatter Chart drop-down menu. Replace the bar chart with bubble chart in Google Sheets.
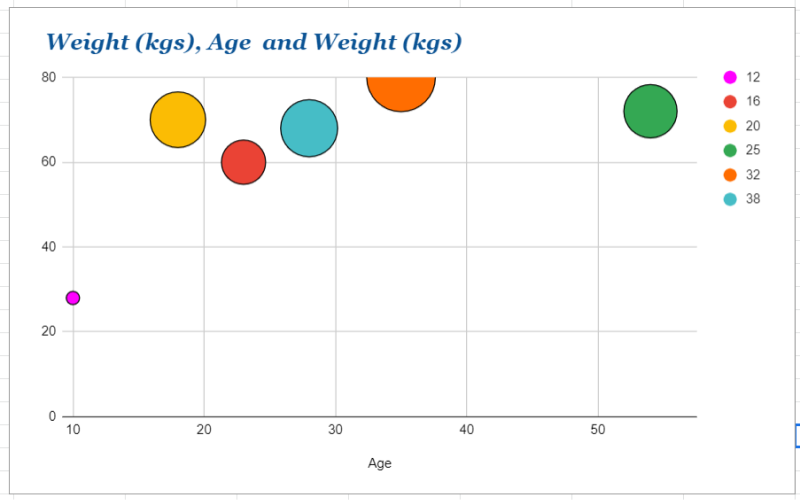
Step 5: Customizing the Chart
Go to the Customize option in the chart editor and edit and format your Bubble Chart. You can customize everything from the chart's font, size, color, and other attributes.
Once you're satisfied with the final appearance of your Bubble Chart, shut the chart editor and save your sheet. Hopefully, these techniques will assist you in creating a bubble chart using Google Sheets.
1.1 The Advantages of Making a Bubble Chart in Google Sheets
Bubble Charts are yet another type of Scatter Plot where we visualize the data in the form of bubbles. There are some advantages of making a bubble chart in Google Sheets, like:
- With Google Sheets, everything is online, so you do not have to worry about storing your Bubble Charts in your system.
- Remote collaboration with Google Sheets is excellent. You can share the Bubble Chart design with your team, and everyone can work on it together.
- If you create a Bubble Chart in Google Sheets, you can add the text box, change the background color, connect the text with the appropriate lines, and more.
1.2 The Disadvantages of Making a Bubble Chart in Google Sheets
A Bubble Chart is a perfect graphic organizer if you want to explain some concepts, topics, or thoughts to someone in your team. There are, however, several disadvantages of making a bubble chart in Google Sheets, like:
- Google Sheets is primarily an alternative to Excel or Keynote and is not well-equipped with features needed to create complex Bubble Charts.
- You will have to depend upon third-party add-ons to get access to certain features.
- Google Sheets works online by default, so until and unless you have activated the offline mode, you are bound to lose your work if there is little to no internet connection.
1.3 Tips for Making a Bubble Chart in Google Sheets
If you are planning to make a bubble chart in Google Sheets, there are certain tips that you should consider to avoid unnecessary mistakes in the long run. For instance:
- Always highlight the data inside the spreadsheet.
- Save your time with Google Sheets shortcuts that you can easily find online.
- Always lock cells to prevent unwanted changes.
2. How to Make a Bubble Chart Online Easier
There is a tool EdrawMax Online that shorten your time to create a bubble chart online. Also, it contains substantial bubble chart templates in product and template community that you can use immediately and create chart without efforts.
On EdrawMax Online, you can find thousands of readily available templates and design components to create all kinds of diagrams. The best part is that EdrawMax Online can also be accessed online, letting you work seamlessly on any platform. With simple drag and drop options, you can also create visually appealing bubble charts via EdrawMax Online in the following way:
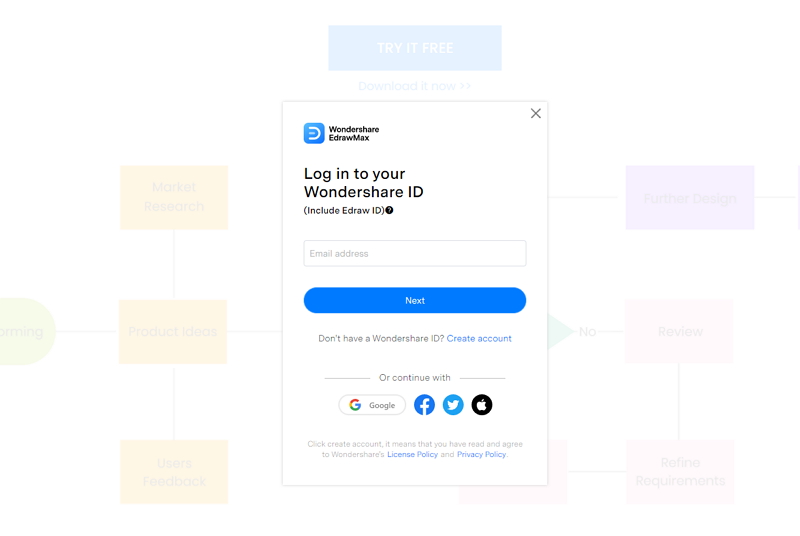
Step 1: Sign In EdrawMax Online
First of all, you need to log in to your EdrawMax Online account. If you haven't used EdrawMax Online before, you can sign up for a free account with your email address. Then you can use EdrawMax for free.
Step 2: Select Bubble Chart
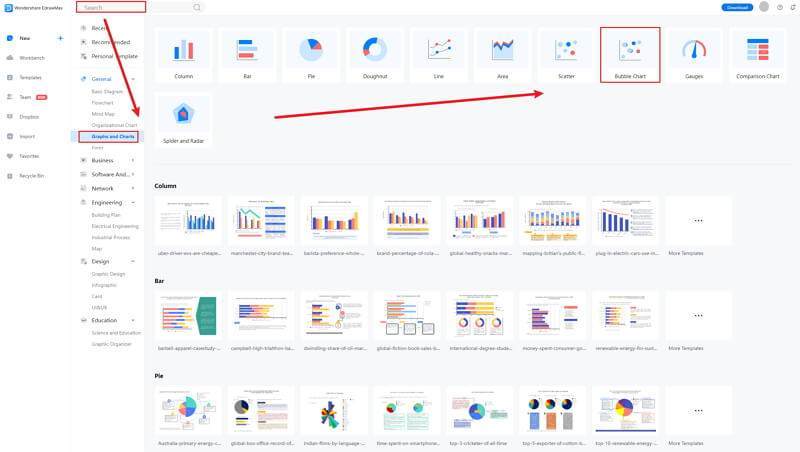
Go to General tab, and find Graphs and Charts to select Bubble Chart. You can use a blank page to create your chart or use a free online template by Edraw. We will use a blank page to create a bubble chart from scratch.
Step 3: Adjust Chart and Enter Data
Now go to Insert Tab and click on Charts. The Insert a Chart window will appear on your screen. Scroll down to Scatter Chart and select the second option, i.e., Bubble Chart. Now press OK to insert a bubble chart. A bubble chart will be added on your Edraw page.
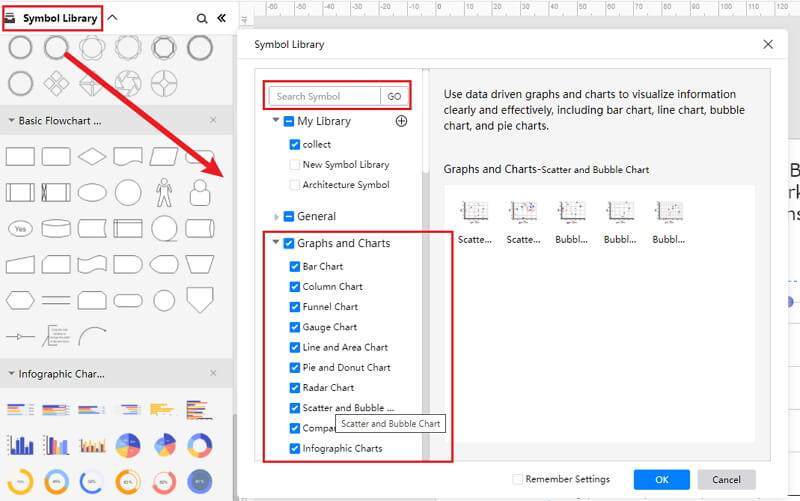
Click the Symbol Library option on the top left side of the editor window. Next, a dialogue box will open. From the dialogue box, go to the Chart menu. A pop-up menu for chart symbol categories will appear. Or you can search the bubble from the Symbol Library. Then, select this option, it will appear on the left side toolbar.
Also, you can choose to insert your data from your end, and the chart will be made automatically.
Step 4: Customize Your Bubble Chart
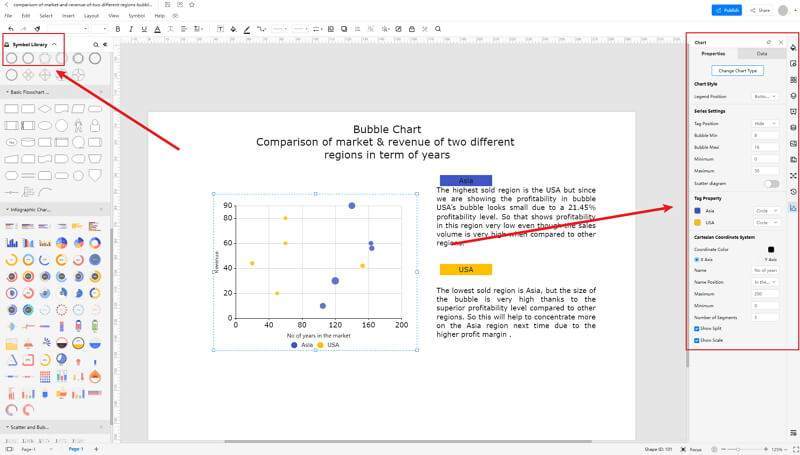
Once the symbols are imported to the editor window, you can drag and drop the chart symbols in the editor to create your bubble chart using them. To edit the symbol, click in the boxes and enter your content. Likewise, you can make the boxes more attractive by using the Fill, Line, and Shadow options.
There are many editing options available in EdrawMax Online to make sure your bubble chart is customized according to your needs. You can change the transparency, change, type of fill, as well as add and remove layers.
Step 5: Export Bubble Chart as Google Sheets
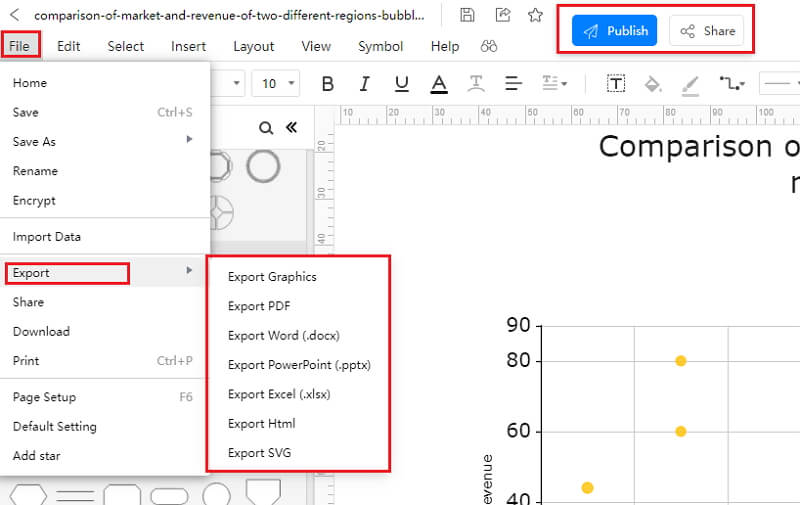
Click on File in the top left corner, from the drop-down menu select Export. From the Export menu, select Export to Excel (.exl), and your Edraw Bubble chart will be saved as a PowerPoint file to your computer. You can also export your files to cloud services like Dropbox and Google Drive on EdrawMax.
If you are still wondering how to make a bar chart in EdrawMax Online, you can check this bubble chart guide for reference.
2.1 The Advantages of Making Bubble Chart in EdrawMax Online
Compared with Google Sheets, there are many advantages that making bubble charts in EdrawMax Online:
- EdrawMax Online supports to make bubble charts online, and will be automatically saved, which means you could make charts in any where at any time.
- EdrawMax Online has a powerful Template Community, that you can find inspirations from thousands of templates made by Edraw users.
- EdrawMax Online supports to export and import multiple file formats, which ensures that you can make continue your work from other platform to EdrawMax Online, or you can export your bubble chart from EdrawMax Online, and attached to other files.
- Or even you can showoff your bubble charts with others by using Presentation Mode.
2.2 The Disadvantages of Making Bubble Chart in EdrawMax Online
Even though there are some advantages of using EdrawMax Online as the tool to create your bubble chart, certain limitations affect the overall quality of the project. For instance:
- EdrawMax Online contains limited bubble chart related symbols, but you can create your symbols and save them for the use of next time. However, it is good for you to make your own bar graph symbols, you can create symbols from EdrawMax, or you can import the symbols you like and save into your symbol libraries for later use.
2.3 Tips for Making Bubble Chart in EdrawMax Online
Creating bubble charts in EdrawMax Online could be easier thing than making in PowerPoint, since there are resources and powerful export function.
- Choose a built-in template from Template Community to start quickly.
- Use powerful toolbars on the right and left sides of canvas to make your bubble charts more stunning.
- Export your bubble charts in mulitple formats to meet your needs, or share to your social media, email, and print it out.
3. Google Sheets Bubble Chart Templates
The followings are the bubble charts PowerPoint templates, you can refer to them, or even use them immediately with ease. Or you can find more bubble chart examples for further reference.
Bubble Chart Template
The following Bubble Chart is here to illustrate the Earth's knowledge. As all the science and non-science students know, Earth is the third planet from the Sun and the only astronomical object known to harbor life. The Earth Bubble Chart helps you visualize the data related to planet Earth in a more concrete format.
As you see here, you can have multiple sub-points leading to other important areas of visualizing the planet Earth. For instance, Earth has a distribution of Sea and Land. As per the Bubble Chart, the Ocean is at 70 percent, and the Land is only 30 percent. Similar to this data, you can further elaborate your primary concept.
Source:EdrawMax Online
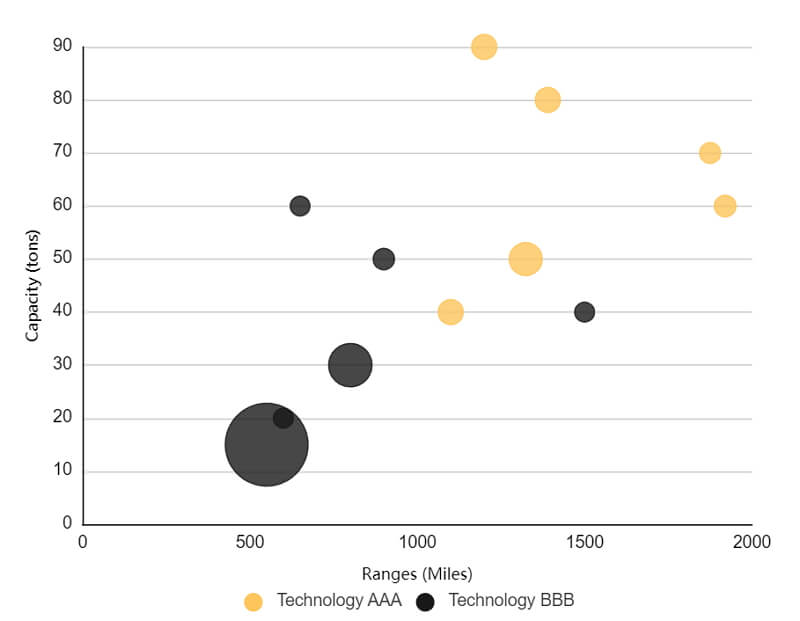
Bubble Chart Excel
Bubble maps are visual representations of data compiled in an organized manner. The following bubble chart a type of chart that displays three dimensions of data. One can make a Bubble chart to compare products with different technology..
You can use EdrawMax Online to create similar-looking bubble charts or take inspiration from the free template and create your own using the drag-and-drop feature of this chart maker. With EdrawMax Online, you can create Bubble Charts that present the data in eye-catching visuals.
Source:EdrawMax Online
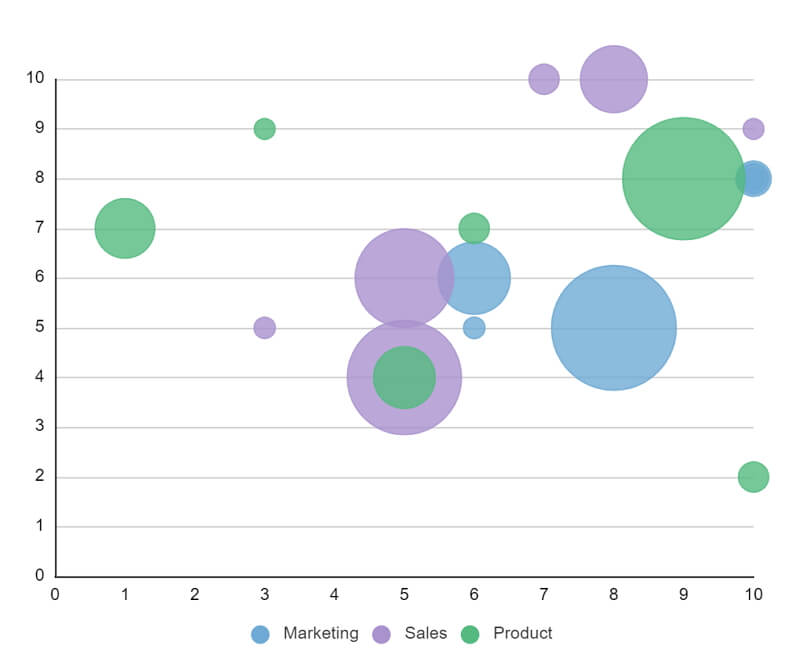
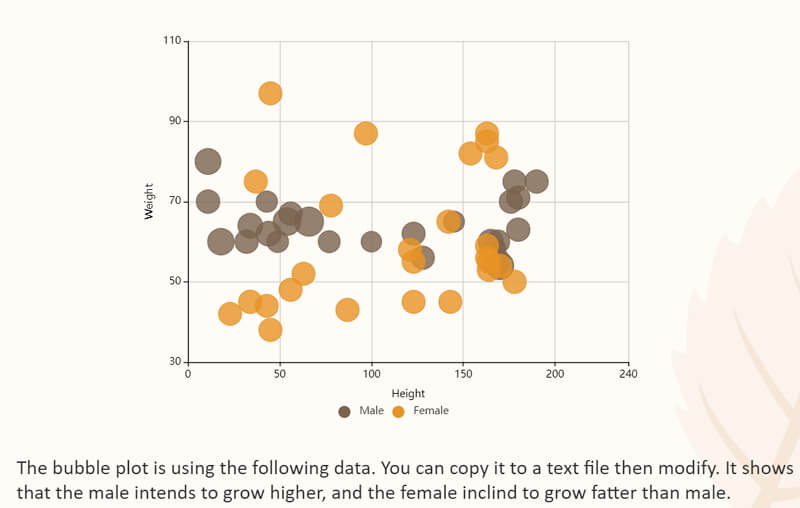
Bubble Chart Google Sheets
A bubble chart is pretty similar to the scatter plot; the only difference here is that instead of plots, we use bubbles and display the data in a three-dimension format. Each entity is used to represent the correlation between numeric data. As you can see from the Bubble Chart example here, we have Height on the X-Axis and Weight on the Y-Axis.
Source: EdrawMax Online
4. EdrawMax Online Feature
EdrawMax Online is a free online bubble chart makerith a user-friendly user experience, free templates, and the ability to create your symbols, this chart can swiftly create complicated and complex charts for your professional or personal needs.
- There are thousands of design elements in EdrawMax Online that can help you create 280+ different types of diagrams.
- You can also browse its extensive range of templates in EdrawMax Template Communityand can readily customize them as per your requirements.
- EdrawMax Online is a free cross-platform tool that you can access on any browser and use without any prior designing experience.
- There are dedicated features to customize your diagrams and export them in numerous formats like PNG, PDF, TIFF, SVG, and more.
EdrawMax Online also lets you export your bubble chart design into multiple formats, making the files highly independent of the platform you are using.
5. Key Takeaways
Creating a Bubble Chart in Google Sheets seems easy and affordable, but several gray areas need to be addressed. Unlike other drawing tools, Google Sheets is primarily an alternative to a spreadsheet, so it does not offer too many features for chart making. On the other hand, EdrawMax Online is well-equipped with free bubble chart templates that are 100% customizable.
In addition to the customizing features, EdrawMax Online takes extra precautions when it comes to the safety of your work. If you work online, all your bubble chart designs are stored in your private cloud storage. Moreover, if you are using the desktop version of the system, you can simply save the file locally.