What is Gantt Chart
Create a Gantt Chart on Edraw.AI Online Free Free Download Free Download Free Download Free DownloadProject management is quite similar to the “juggling” act performed by entertainers. If you miss one juggling pin or ball, the whole action gets ruined. In the very same way, project management also entails juggling between people, multiple tasks and projects, and more. If you miss one deadline, then the whole project is delayed, and this is not good for business. It is where the Gantt Chart plays a vital role.
With the help of a well-designed Gantt Chart, you can have a visual overview of your entire project schedule. Also, you can see the deadlines set for each task, which team is working on what project, and how far the project has advanced. In this article, we will look at all these aspects and more about Gantt Charts.
What is a Gantt Chart?
Gantt Chart is a straightforward yet useful tool for every project manager. To complete a project successfully, one needs to control an array of tasks. No matter how stringent adequate supervision can be, with a Gantt Chart, the progression path towards your goal gets clear.
It is a visual timeline of projects in the form of a bar chart. It shows the entire project schedule and illustrates various relationships between the tasks performed and the current status of the project schedule.
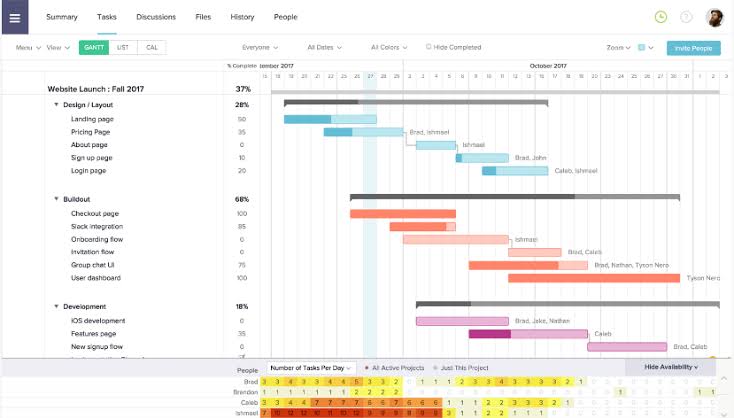
Image Source: gstatic.com
History of Gantt Charts.
The foundations to the Gantt Chart were first laid in the late 1800s when a Polish engineer Karol Adamiecki first introduced the Harmonogram, which is the predecessor of the Gantt Chart.
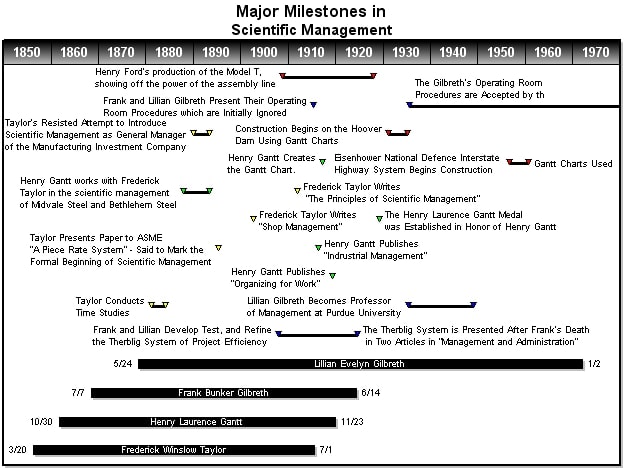
Image Source: gstatic.com
In 1910, American Mechanical Engineer, Henry Gantt took the Harmonogram to its next stage, namely the Gantt Chart, while working alongside a colleague. One of the earliest known applications of the Gantt Chart is known to be undertaken in World War I by the Americans.
The early Gantt Charts were hand-made. Hence, for any update or changes, the chart was redrawn completely.
In the 1980s, with the advent of personal computers, these charts were revolutionized, and complex Gantt Charts could now get created. By the late 1990s, with the arrival of the Internet and the world wide web, these charts became a ubiquitous feature of many web-based applications.
By 2012, the software was the sole source of creating almost all Gantt Charts.
Why do we need Gantt Charts?
- Keep managers up-to-date about the ongoing project;
- Improvement in communications and collaborations regarding assigned tasks;
- Effective and efficient use of resources to avoid overload;
- Easy checking and measuring the progress of the project and changing strategies, accordingly;
- Monitor task dependencies and strategize accordingly so that no task gets hindered;
- Provides clarity to the project underway and helps managers to pull it out with ease;
- Improves time-management skills.
When to use Gantt Charts?
By now, you know what a Gantt Chart is and how it can benefit projects and the team undertaking the projects. But you must be asking yourself that “when do we use the Gantt Charts?” Fret not, for in this section; we will see when to use a Gantt Chart.
Well, be it a production unit or a construction project, or a software development project. A Gantt Chart is applicable in any case. You can even deploy a Gantt Chart if you are preparing for any nation-wide exam. However, here, we will look at a few situations when the Gantt Chart becomes very important:
As we have many times already, a Gantt Chart helps visualize the overall tasks of the project and thus helps to schedule the whole project accordingly. It takes into account certain factors like the deadline for the project, various tasks included, the time needed for their completion, resources required and available at hand, and the critical path of the project.
- Critical Path: it is the longest path or sequence of activities that you need to accomplish for the completion of a project within the stipulated time. It is measured from the start of the project until the project is handed over to the client.
- The path displays a sequence of activities or tasks whose completion is vital to the success of the project. Failure of one would mean the collapse of the next, which would ultimately lead to the failure of the project as a whole. These critical tasks are commonly and collectively called “dependencies.”
There are four significant types of dependencies:
A. Start-to-finish: Task A is to start before Task B gets over;
B. Start-to-start: Task A is to start before Task B completes;
C. Finish-to-finish: Task A is to finish before Task B is over;
D. Finish-to-start: Task A is to complete before Task B begins.
A Gantt Chart helps to track all these dependencies as well as the time pockets between two jobs, i.e., the time delay acceptable for each task. With so many factors to look after, the human brain is likely to miss out on some. But, the Gantt Chart, on the other hand, does not, and that is why it is the best tool to track a project.
A project report is something that helps managers stay updated about the overall progress of a project focusing on aspects like the schedule and deadline, budget, project aims and goals, and more. Your investors and shareholders will always want to know where the project is standing; in simpler terms, what fruit has their money bore. It is where a Gantt Chart shows its miracles.
With its insightful and visually- engaging format, you can easily describe the overall progress of the project in just a few minutes and in an effortless way. Moreover, you can have accurate information about the various metrics involved in the project, as well as a clearer understanding of the workflow and to determine a precise delivery date for the project based on its current state.
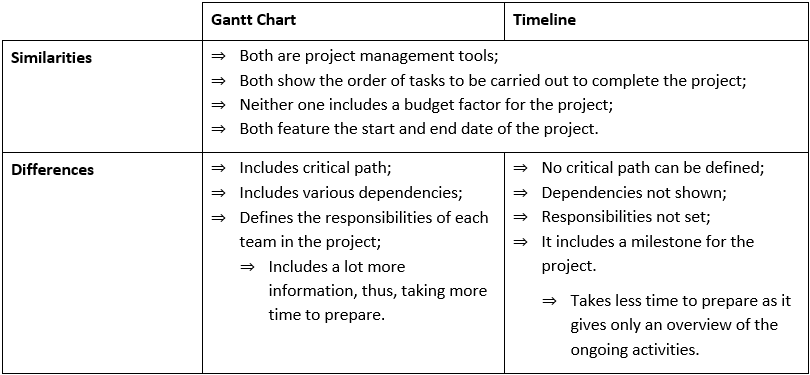
Gantt Chart vs. Timeline.
In essence, both the Gantt Chart and Timeline are the same thing. They are both project management tools and displays the project path and chronological order of the included tasks to be carried out. However, they differ from each other slightly in appearance and information included. Below is a tabulated comparison of the two types of project management tools, taking into account the similarities and differences between them.
In general, most organizations employ the use of a timeline along with either a Gantt Chart or a Work Plan.
Gantt Chart Examples.
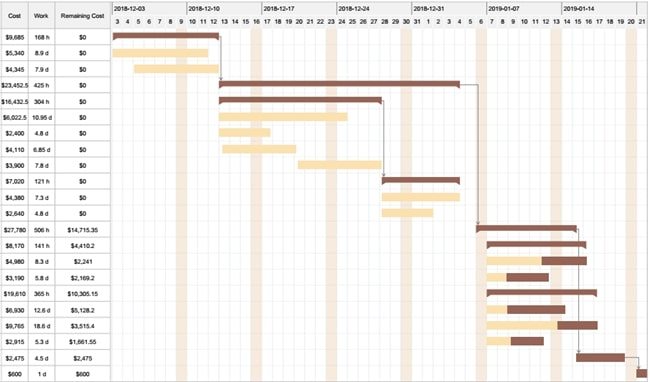
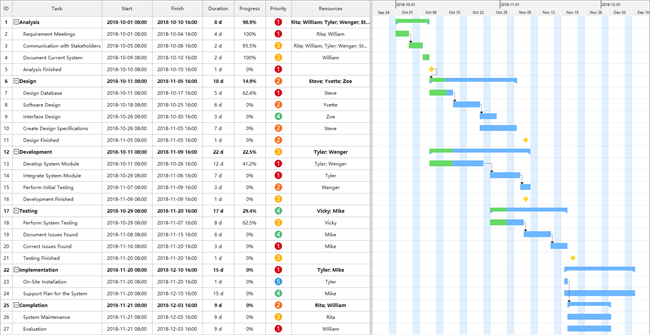
This kind of Gantt Chart shows the various tasks included in developing new software along with provisions for future updates and version releases. Every software development company uses one such Gantt Chart. Below is a glimpse of how a Software Development Gantt Chart looks.

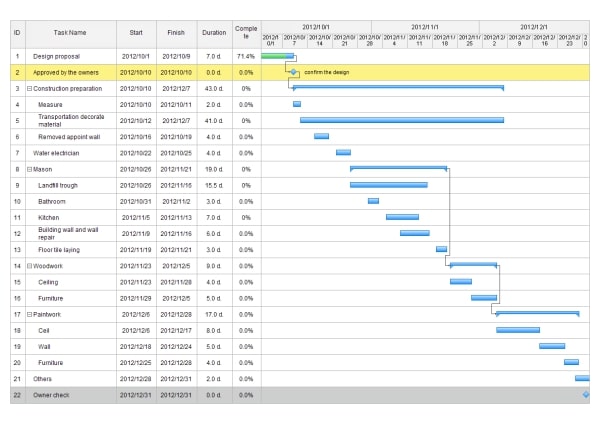
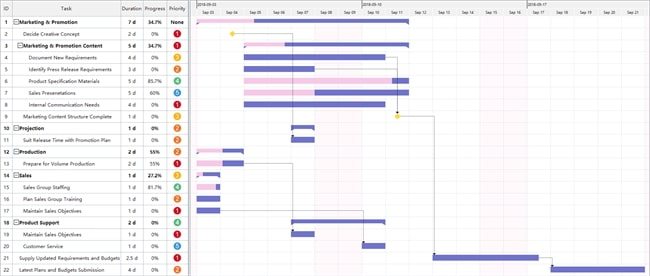
Interior designing and decoration firms also use the Gantt Chart for their projects from time to time. As we saw that a Gantt Chart could get used for every kind of project, then why not for such a process. The various aspects like resources and tasks, their progress, along with dependencies in the project, get visually represented here.
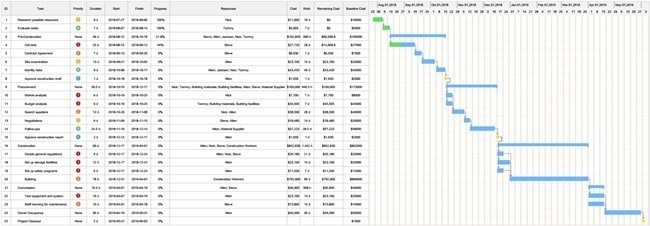
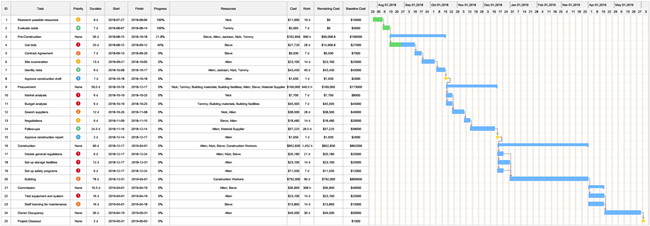
Managing moving parts along big construction projects can be made very easy with the help of Gantt Charts. It is why the construction site and project managers often use them. You can break each phase of the project and show the dependencies smoothly with a Construction Scheduling Gantt Chart.
How to Make a Gantt Chart with EdrawMax online?
I know you all have been eager to see how you can draw a Gantt Chart. Well, with EdrawMax online, it is quite an easy task. However, before we start to draw one, it is necessary to make some preparations.
- Understand what your project is and analyze the end goal;
- Chalk out a step-by-step list of activities;
- Determine an estimated time of completion for every task;
- Measure the resources you have for the project to those you need;
- Determine the critical path;
- Determine the dependencies along the critical path;
- Distribute the project among the teams with clear responsibilities for each group.
Now, we will walk through a step-by-step guide for creating a Gantt Chart with the help of EdrawMax online.
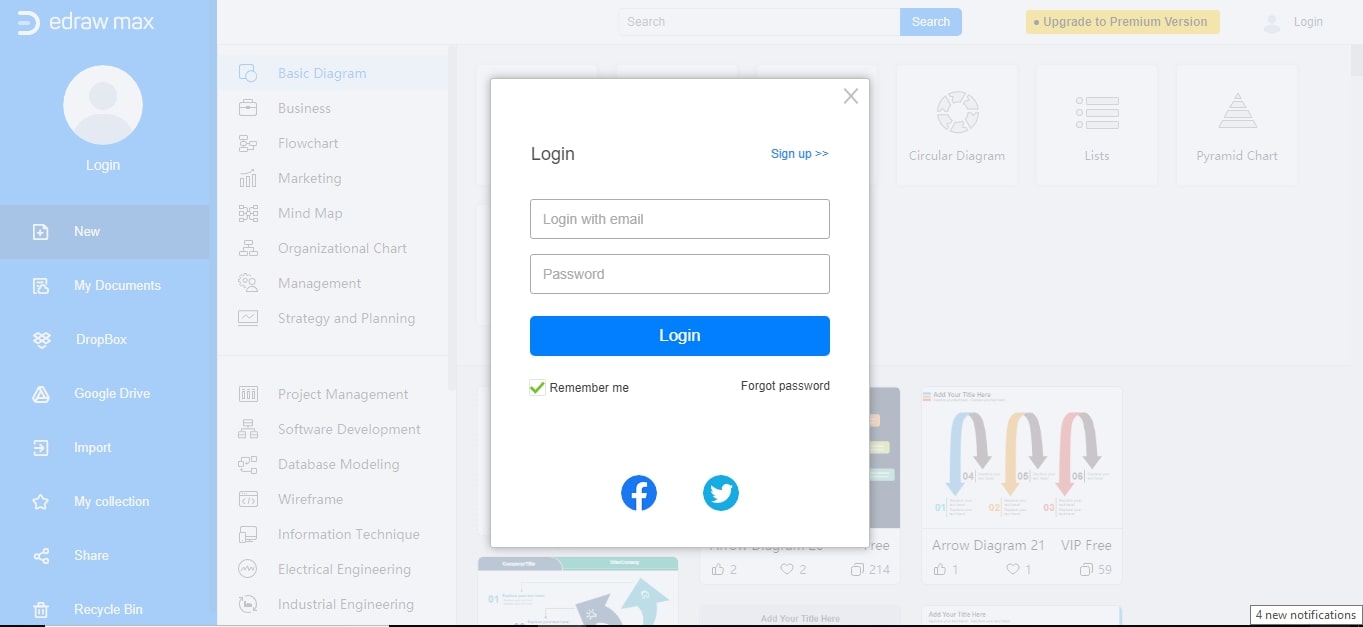
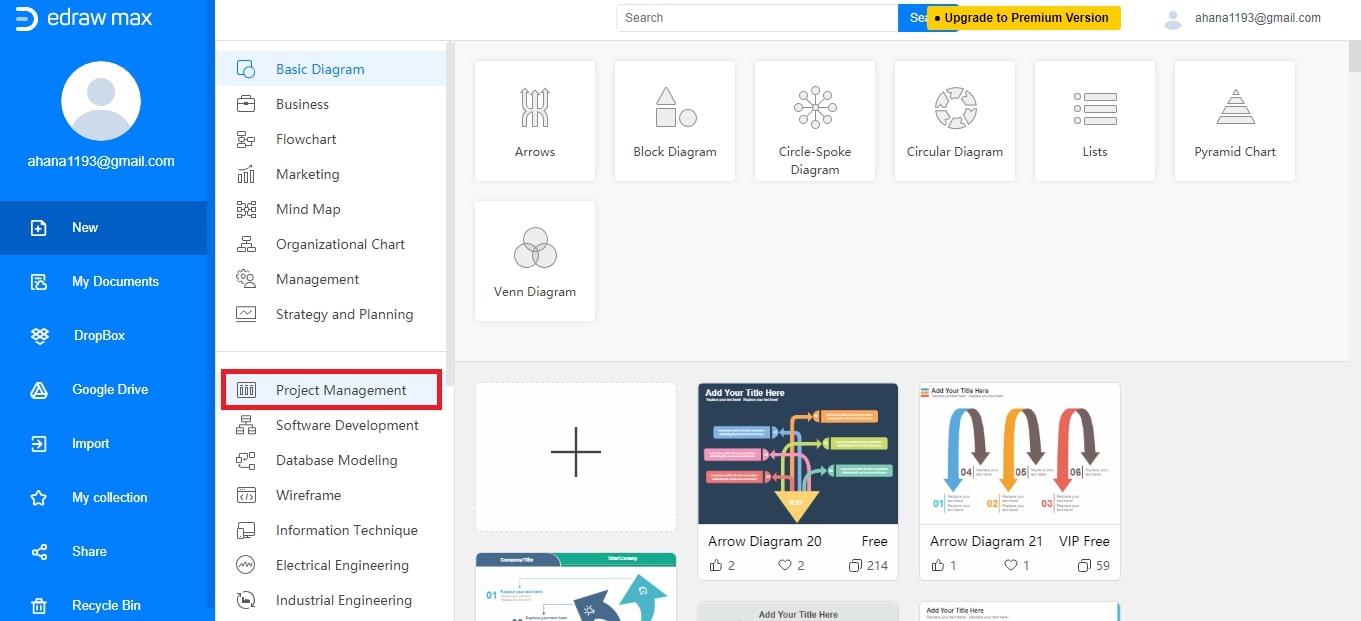
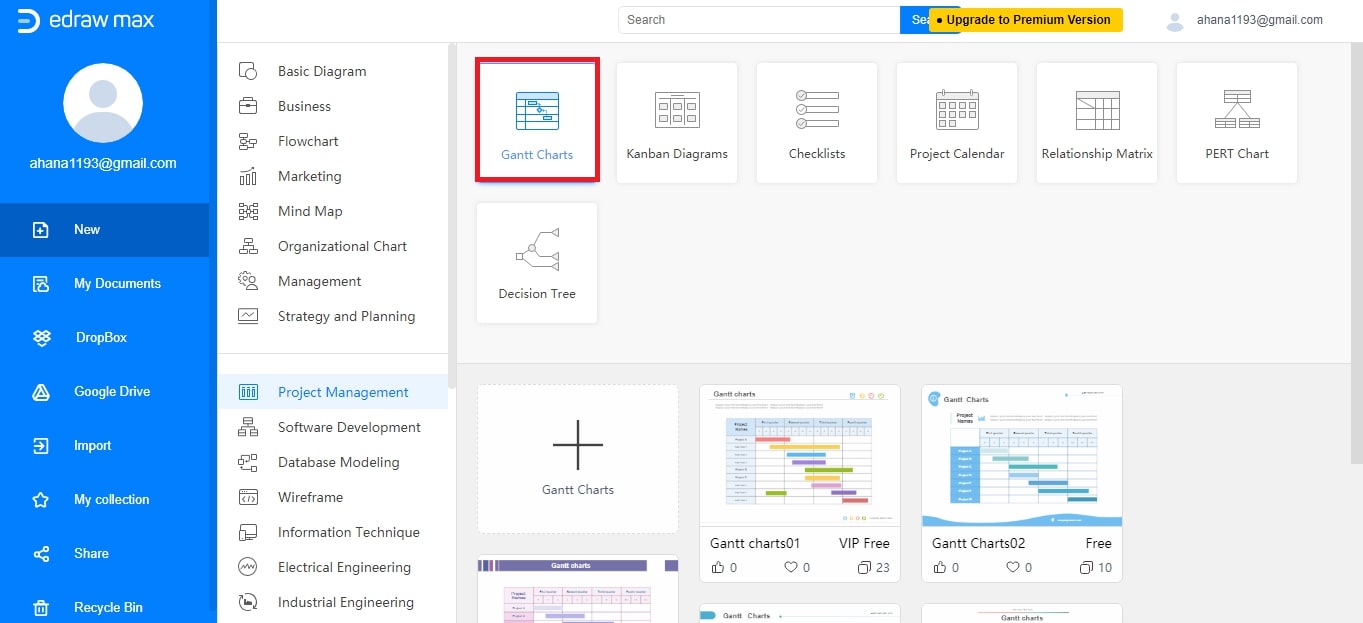
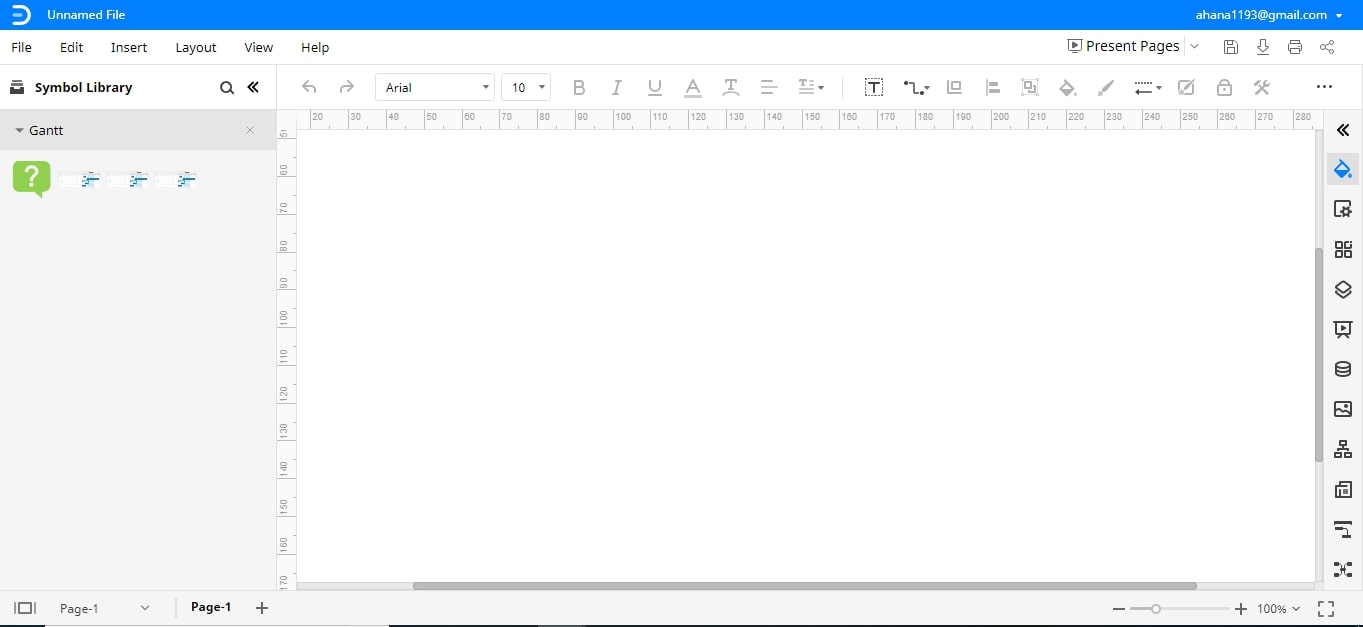
a. If you want to create a Gantt Chart with customizations, then click on “+.”
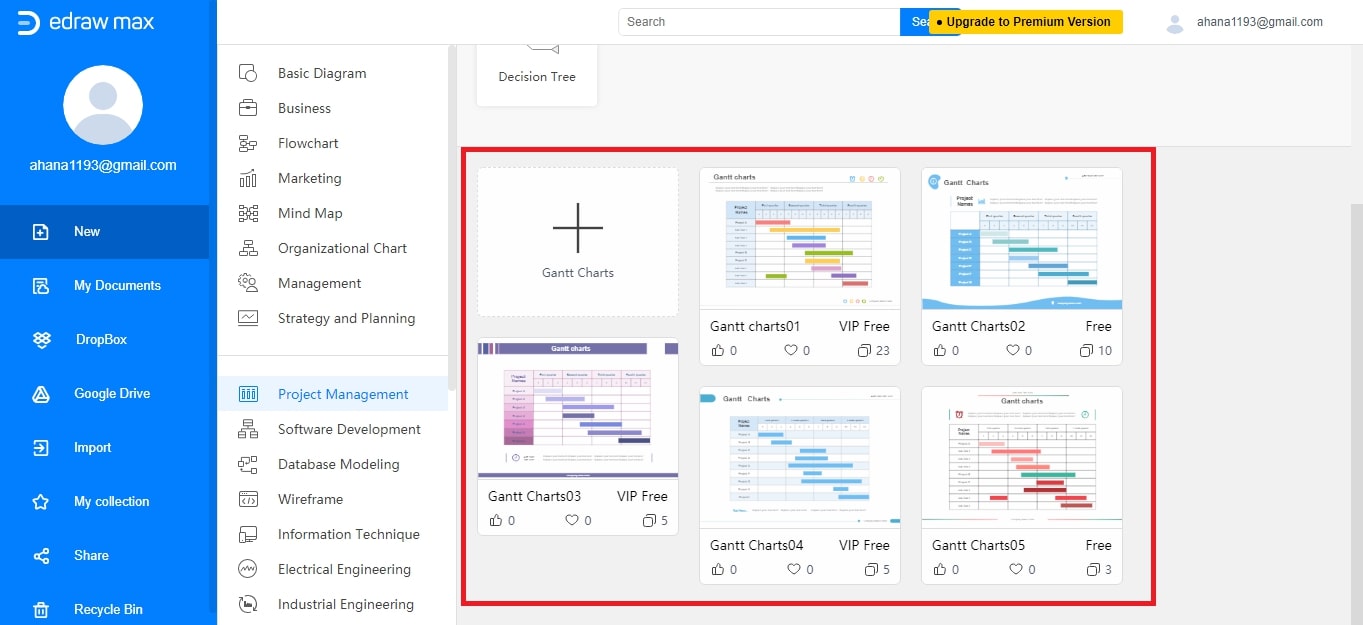
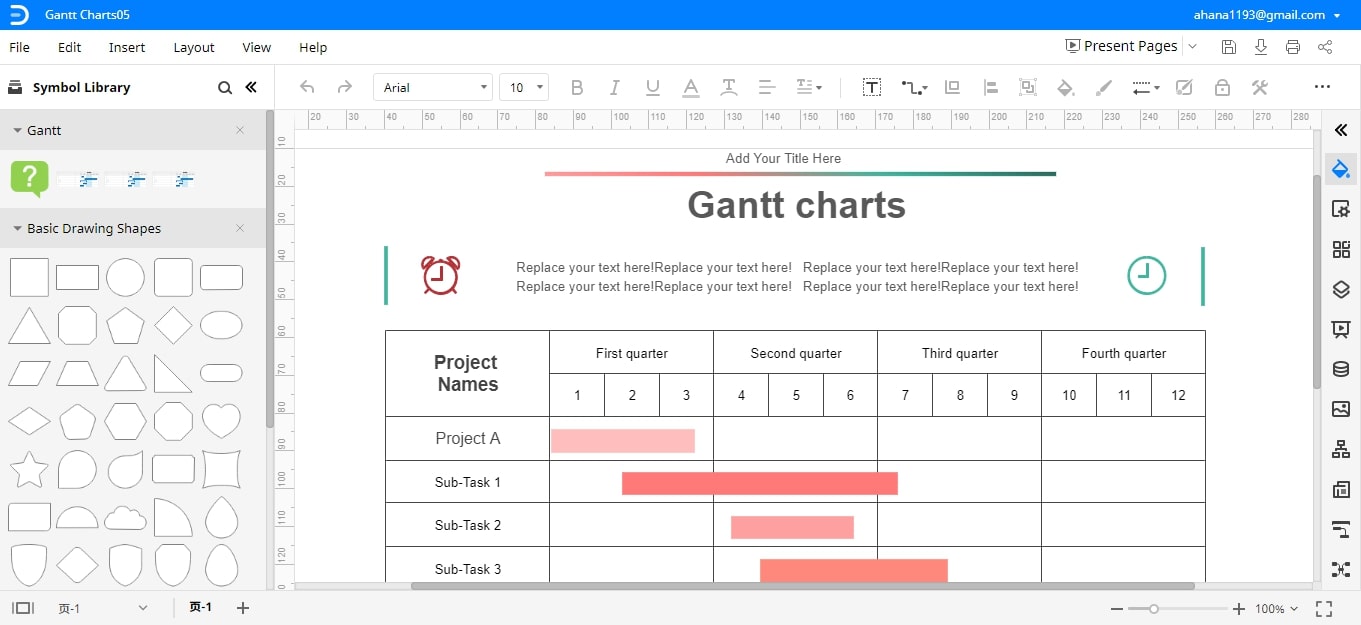
b. If you want a Gantt Chart with an existing template, then select any from the available ones.
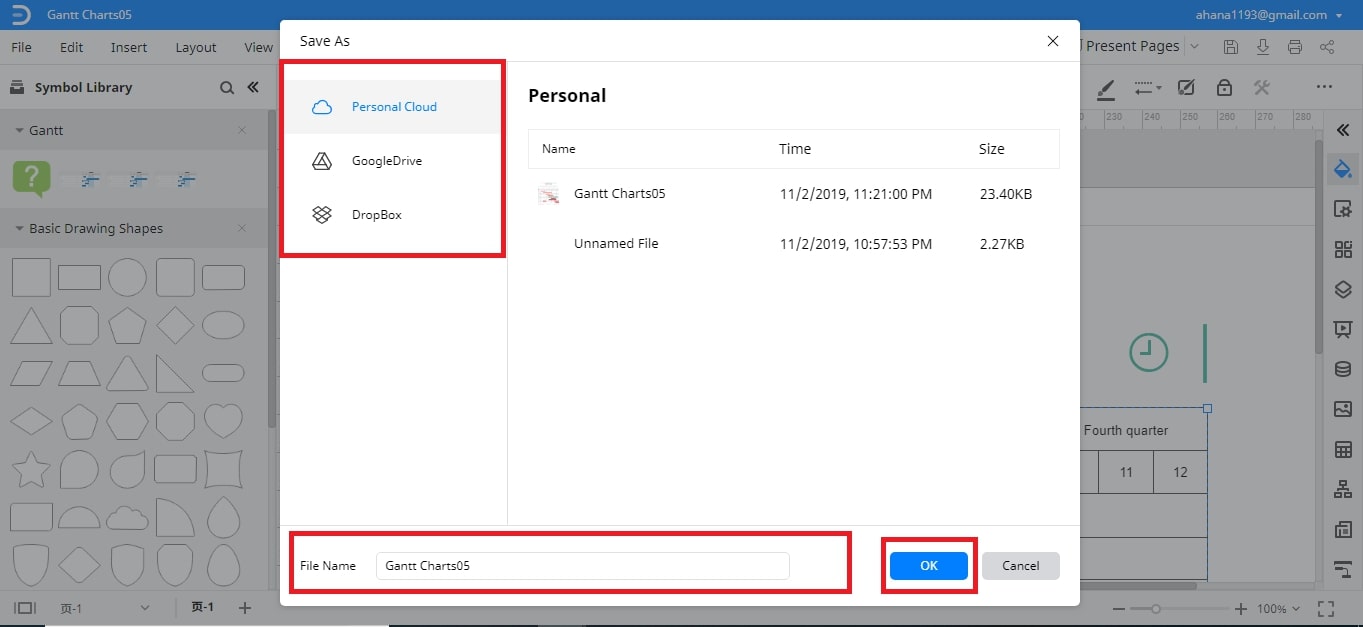
[ File > Save As >Select your desired location – “Personal Cloud”/ “Google Drive”/ “DropBox” > Give a desired “File Name” > Click on “OK.” ]
More Gantt Chart templates.
Here are some more Gantt Chart templates:
1. Software Development Gantt Chart Template
2. Interior Decoration Gantt Chart Template

3. Construction Scheduling Gantt Chart Template
4. Product Launch Gantt Chart Template
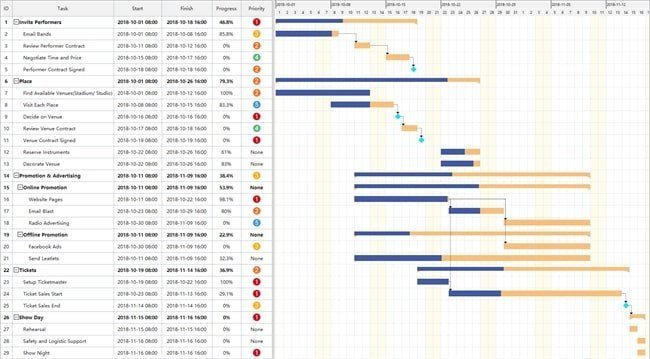
5. Show Planning Gantt Chart Template
6. Market Strategic-Planning Gantt Chart Template