How to Make a Venn Diagram in Excel
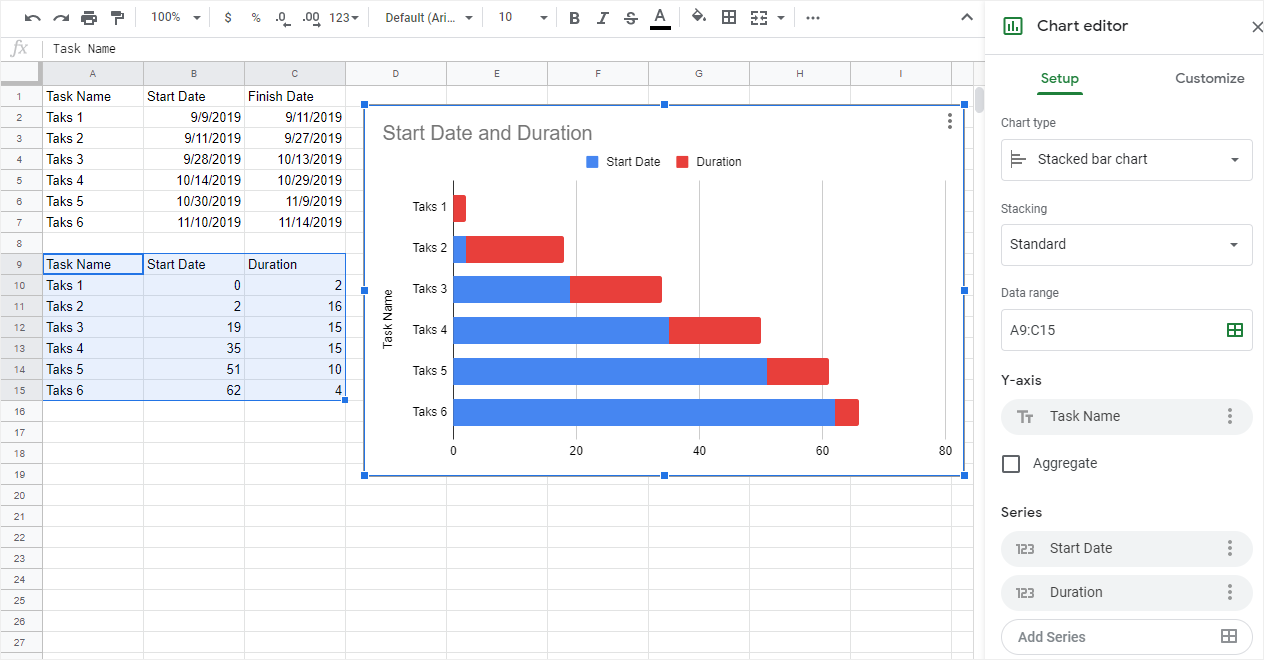
Google Sheets is a perfectly suitable application in G suite for creating Gantt charts and make it easy to share project schedules in your project team. However, you’d have to use the time-consuming features to make a Gantt chart, which is less efficient than in professional tools.
How to Make a Venn Diagram in Excel
Step 1: Open SmartArt Graphic Window
Go to the Insert tab of a new worksheet, click the SmartArt button on the Illustrations group to open the SmartArt Graphic window.
Step 2: Insert a Venn Diagram
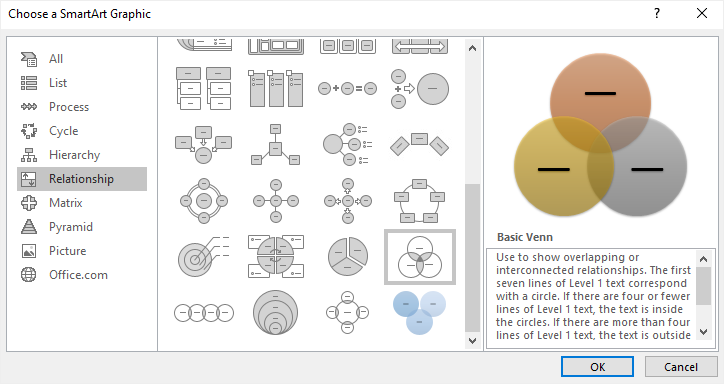
Under the Relationship category, choose Basic Venn and click OK. Then the Venn diagram is added on the sheet.
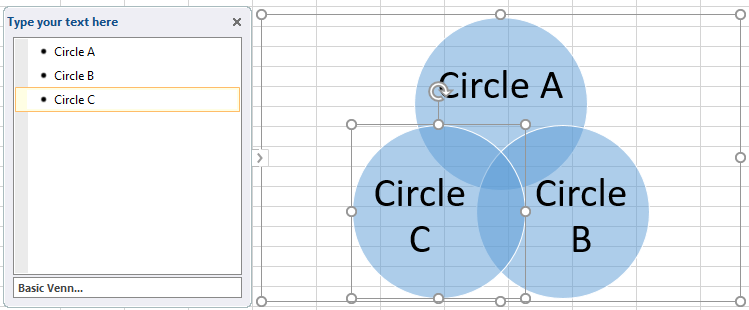
Click on the arrow icon next to the diagram to open the Text pane. You can paste or type the text or numbers on the Text pane.
To add text or numbers on the crossed sections, draw text boxes onto the circles.
Step 3: Add Circles to Venn Diagram
To add more circles to the Venn diagram, click to select the whole diagram at first, then you can try the following 2 ways:
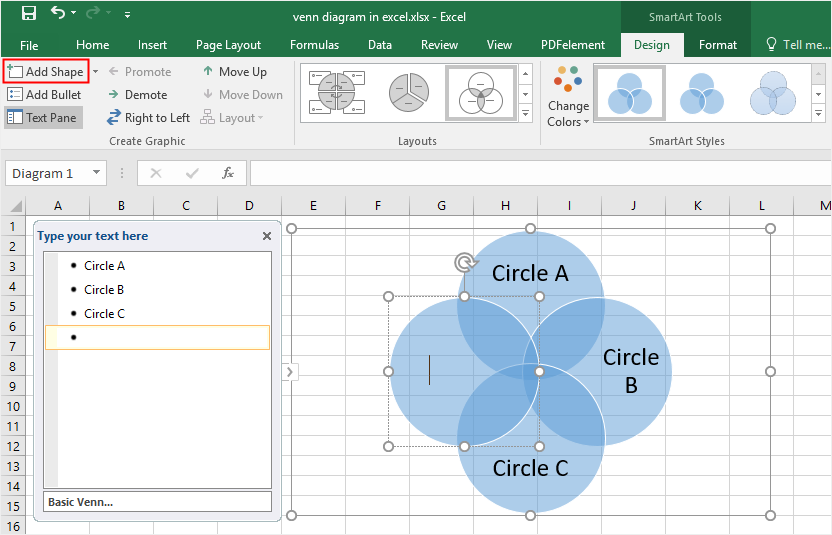
- Go to the Design tab of SmartArt Tools, click Add Shape button on the Create Graphic
- On the Text pane, select a bullet, press Enter to add a new one and a blank circle will be added on the diagram.
Similarly, these circles can be deleted by clicking on the shape or its corresponding bullet and pressing Delete.
Step 4: Style Your Venn Diagram
To style the Venn diagram in Excel, there are many different formatting tools:
- Go to the Design and Format tab Of SmartArt Tools where you can change diagram layouts, colors, styles, etc.
- Right-click on the circle, select Format Shape on the context menu, and then you can change the fill style, fill color or another option.
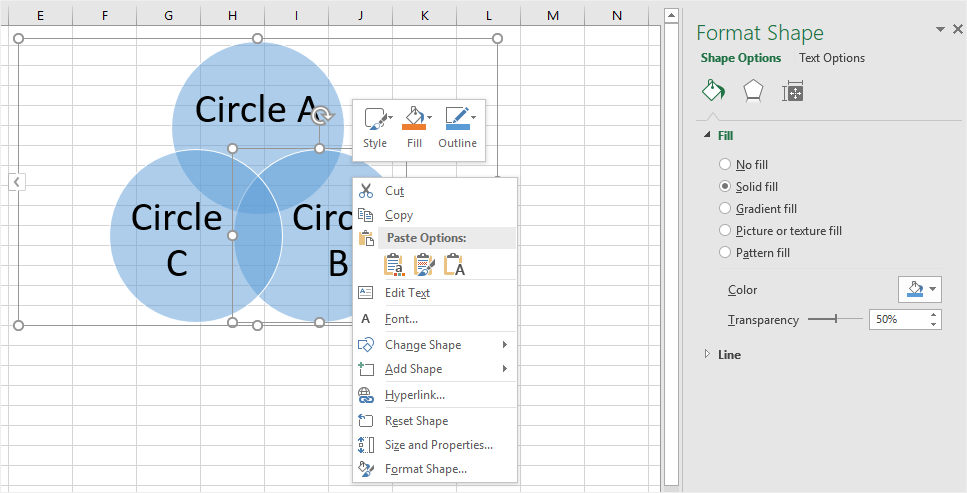
- The right-clicking menu also provides other quick options, like Change Shape, Add Shape, or Reset Shape.
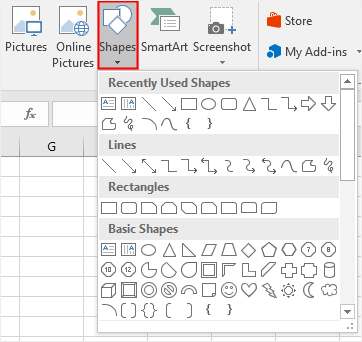
If you have no access to SmartArt Graphics, you can manually create a Venn diagram by drawing circles.
Like adding SmartArt graphics, click the Shape button under the Insert tab, and pick the shape of Oval from the shape gallery. Then you can draw a lot of circles on the sheet.
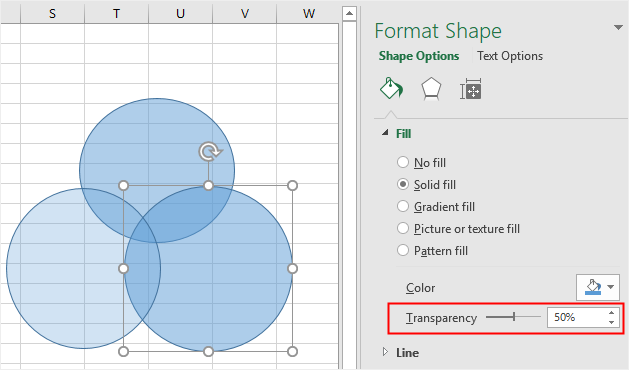
Do remember that you need to increase the fill transparency of each circle in the Format Shape pane, otherwise, the overlapping sections of circles will be invisible.
How to Make a Venn Diagram in EdrawMax
Excel is a very powerful tool in processing data, however, it still has many limitations on drawing diagrams. Here, EdrawMax is comparably suitable for drawing and creating various professional-looking diagrams, including Venn diagrams.
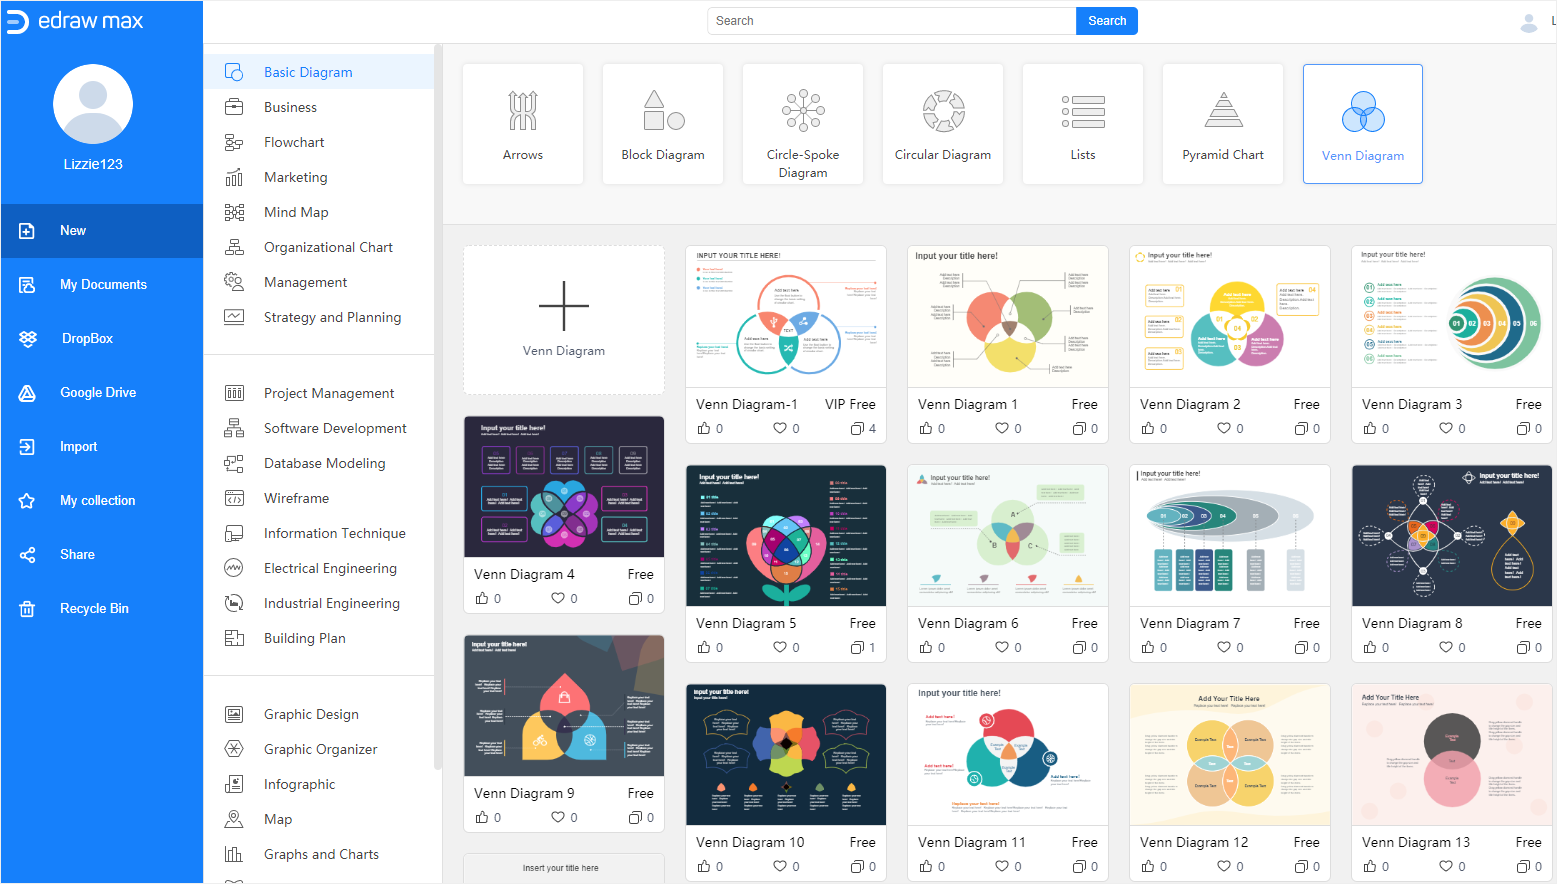
Step 1: Pick Venn Diagram Templates
When you want to add a Venn diagram in your presentation, using a stunning and unique template will be of great help.
Open (EdrawMax Online), find Venn Diagram in the Basic Diagram menu, and you’ll see plenty of Venn diagram templates in the template gallery.
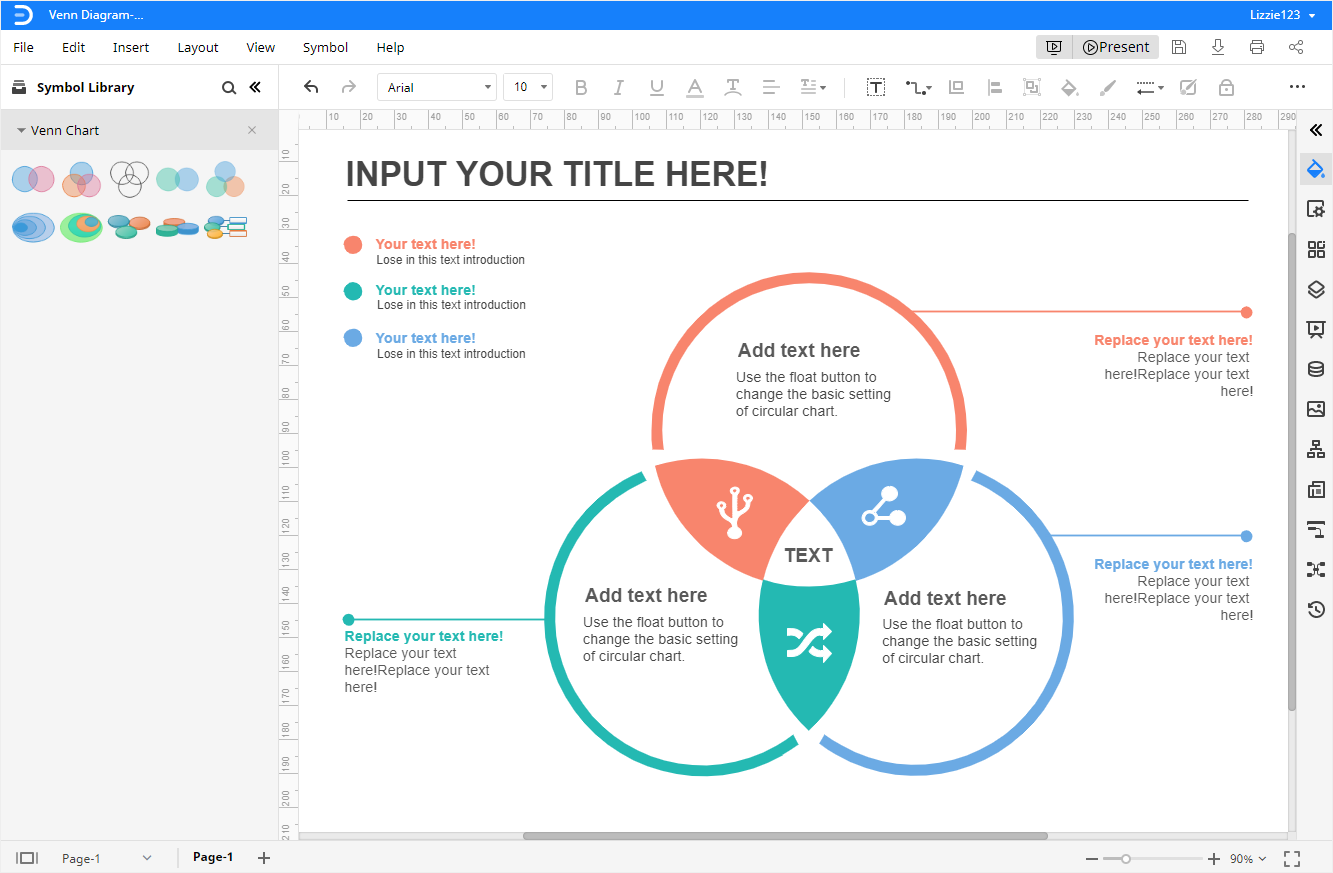
Step 2: Use a Venn Template
Pick one of the Venn diagram templates that you want to use, click on its thumbnail and the template will be opened on a new webpage. Then you can add text or numbers on the template directly.
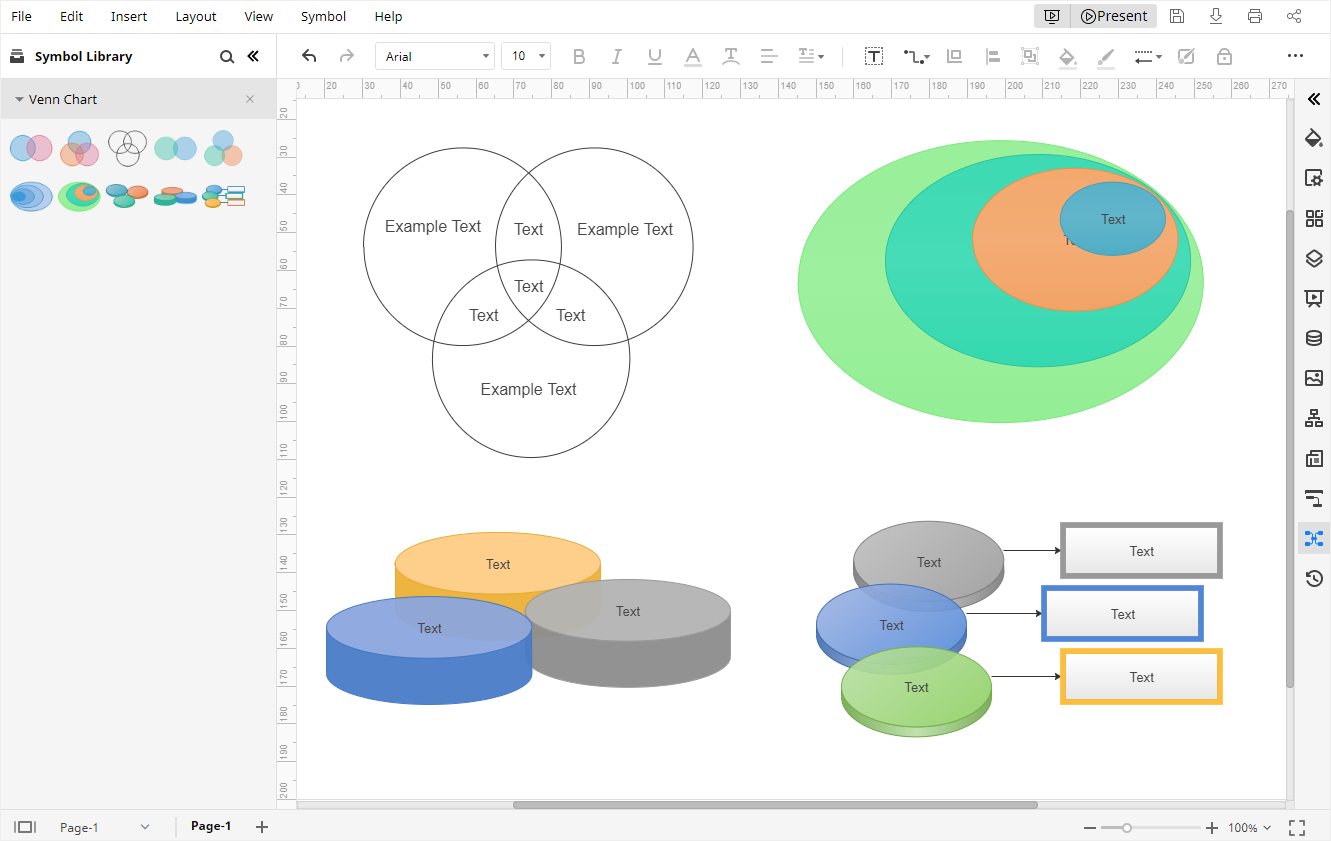
Step 3: Add Shapes Manually
To add shapes manually in EdrawMax, click on the Symbol Library icon ![]() to open Library dialog box, then tick Venn Chart under the Diagram category and click OK.
to open Library dialog box, then tick Venn Chart under the Diagram category and click OK.
The shapes and symbols of Venn diagrams will show up on the Library pane. All shapes and symbols on the Library pane can be directly dragged and dropped on the drawing page.
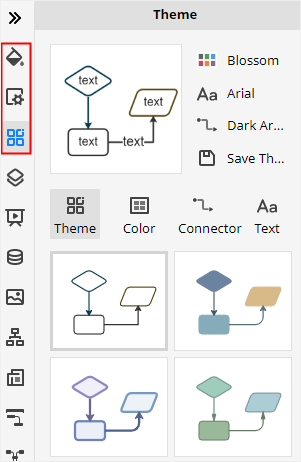
Step 4: Customize Your Venn Diagram
To customize your Venn diagram in EdrawMax, there are also many different choices:
- Change shape styles and colors on the Fill/Line/Shadow
- Change background colors on the Page Setup
- Change diagram themes on the Theme
Step 5: Present Your Venn Diagram
Click the Play button on the upper right corner of the main interface, and the Venn diagram will be displayed on the full-screen mode, just like that you are making a presentation.
How to Save an Edraw Diagram as an Excel File
In the end, when you finish making your Venn diagram in EdrawMax, you will find that EdrawMax supports users to save and export the document in multiple places and in different file formats.
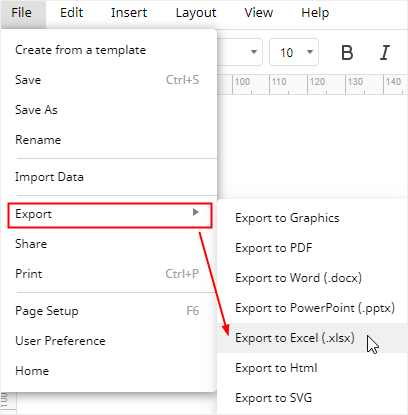
Go to the File tab, click Save As and then you can choose to save your diagram in Edraw personal cloud, Google Drive or Dropbox. Thus, you are able to access the documents from anywhere.
Click on Export and you can choose to export the document in the format of MS Excel. Besides, all MS Office files exported from EdrawMax can be opened and edited in the corresponding programs, which will be more convenient for you to share your creations and designs with others.