How to Make a Pie Chart in PowerPoint
With utilizing the power from Excel, you can make different types of pie charts in PowerPoint as well. In this article, we will show you how to create and insert a new pie chart in PowerPoint and then tell you how to change chart types and alter chart styles.
How to Make a Pie Chart in PowerPoint
To start with, enable PowerPoint on your computer, open a new slide or the slide that you want to insert a pie chart. Then follow along with the steps below:
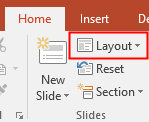
1. Change the slide layout and make it fit for creating the pie chart. In this example, I will choose the Blank
2. Select Insert > Chart to open the Insert Chart dialog box.
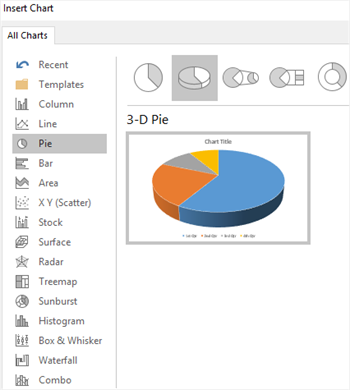
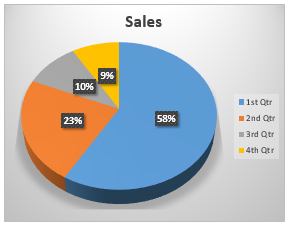
3. Click Pie on the left list, select the pie chart diagram that you want to present, and click OK. Here, I choose 3-D Pie.
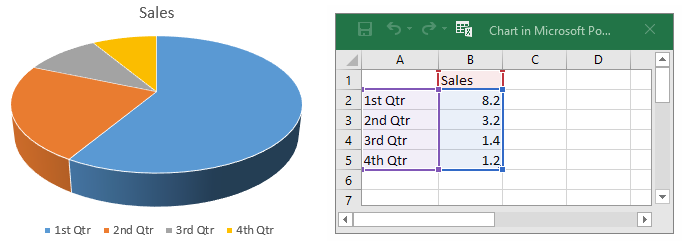
4. An example 3-D pie chart diagram along with a small worksheet shows up on the current slide, replace the example data with your own information. Then you can close the worksheet.
5. To change chart types, select the whole pie chart diagram, click Change Chart Type button on Design tab of Chart Tools.
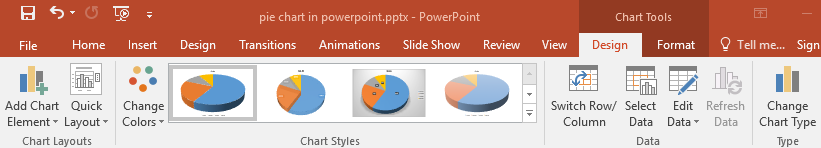
6. To change chart colors, select the whole pie chart diagram, choose a color scheme on the drop-down menu of Change Colors
7. To change chart styles, choose a quick chart style on the small gallery and the chart style will be altered in seconds.
How to Make a Pie Chart in EdrawMax
Apart from PowerPoint, EdrawMax is also an excellent all-in-one diagramming tool. It can not only help you make pie charts but also present them smoothly in a presentation. EdrawMax offers thousands of templates on different topics and you can use these templates to build your own pie chart and presentation.
To get started with a pie chart template, you can follow the steps below:
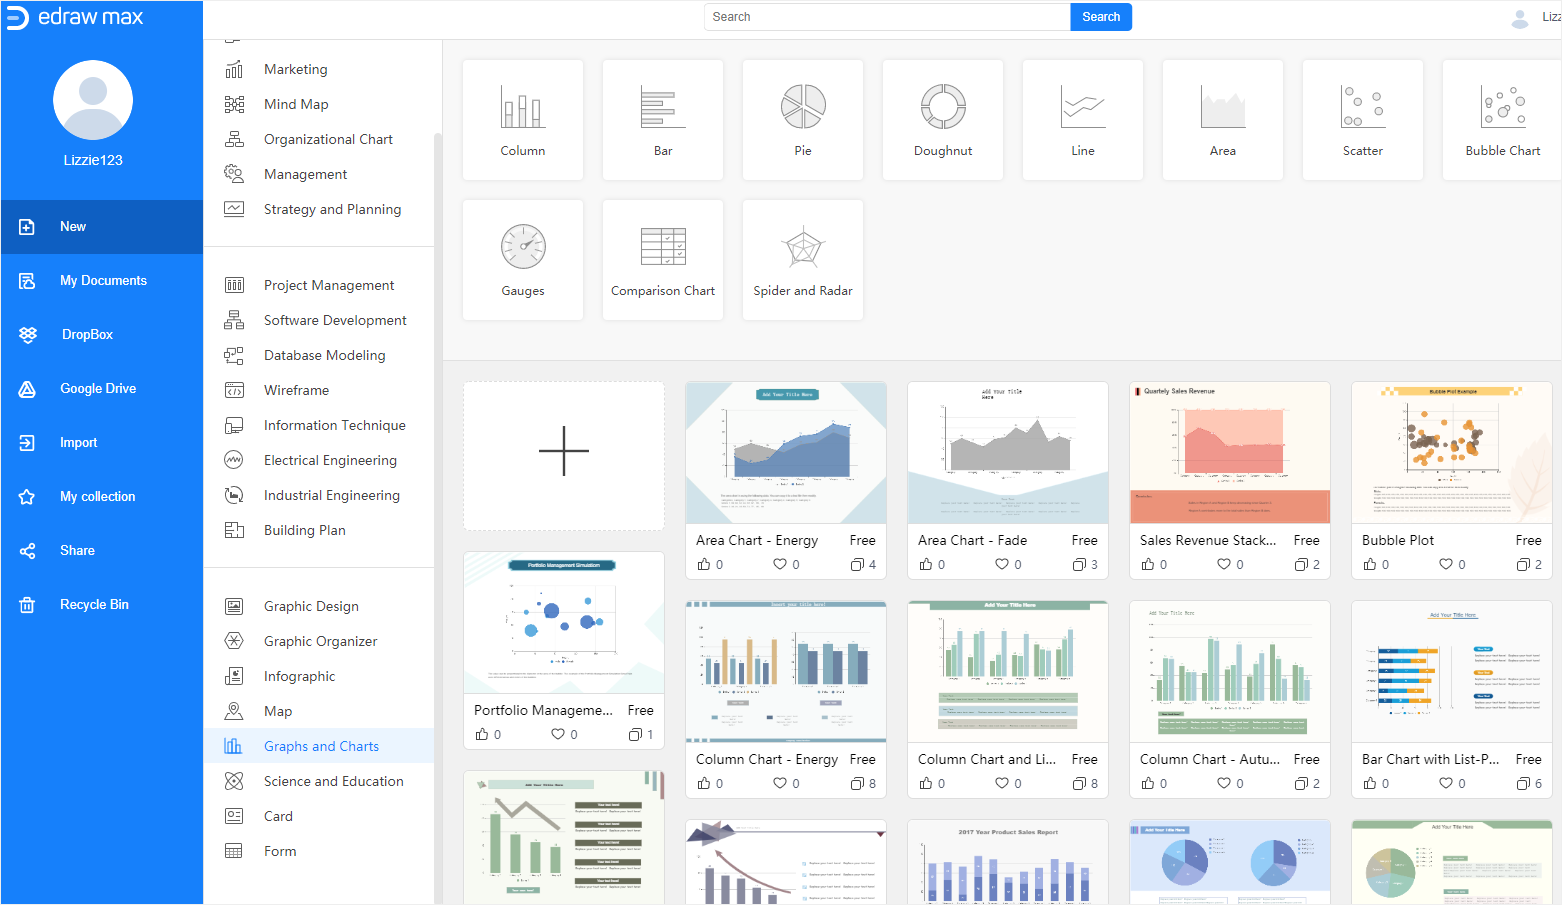
1. Enable (EdrawMax Online), find Graphs & Charts on the diagram type list, choose a pie chart template and click to open it.
2. Edit text, change chart colors or styles until it fits right with editing options on the right-side panes and the toolbar.
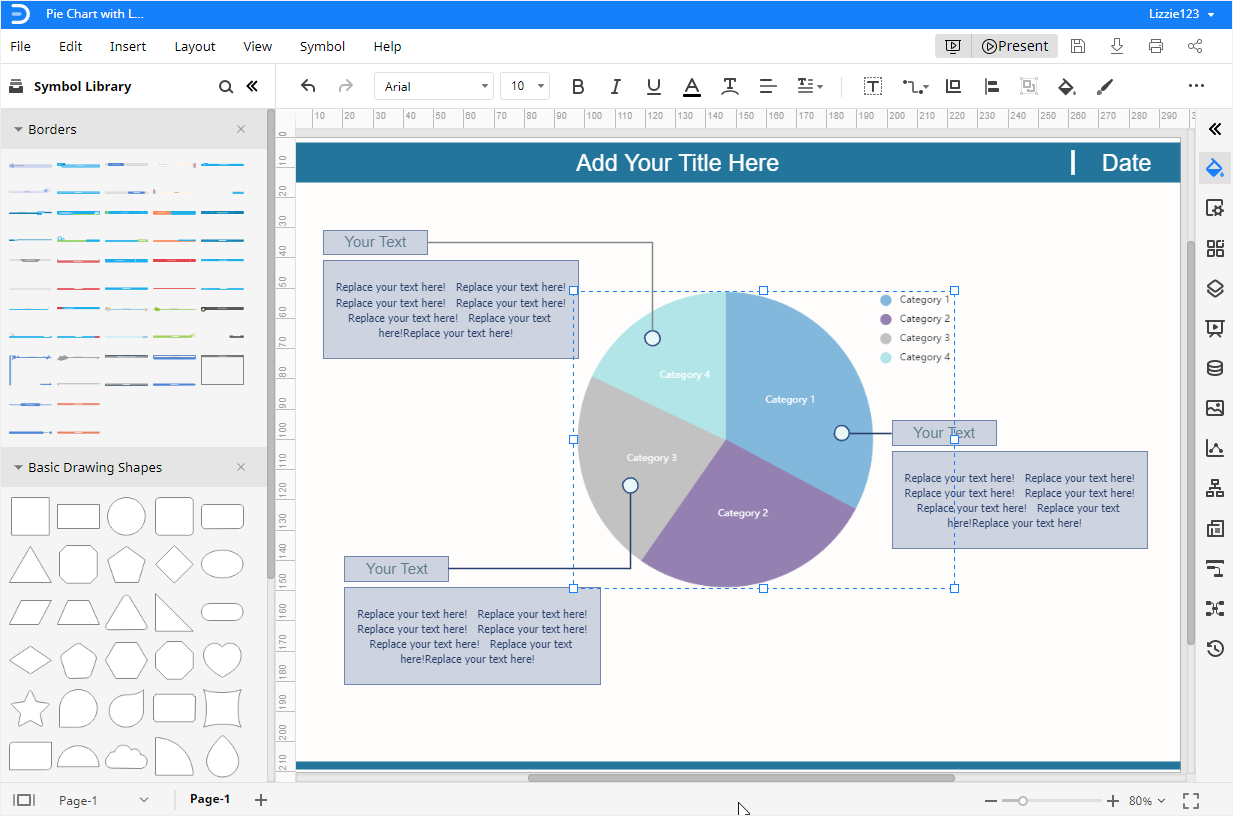
3. Once your pie chart is done, click on the Play button on the upper right corner, and the current page will be displayed in a full-screen mode. There you can check the performance of the presentation at any time.
Similarly, you can start from scratch and make a new pie chart with your data. Here is how to do it in EdrawMax.
1. Click on the plus icon on the Home page to open a new drawing page, or you can open an existing Edraw file where you want to insert a pie chart.
2. Navigate to Insert > Chart and choose the default Pie Chart in the pop-up dialog box.
3. Paste or type your data into Chart (Data) pane and EdrawMax auto-generates your pie chart diagram.
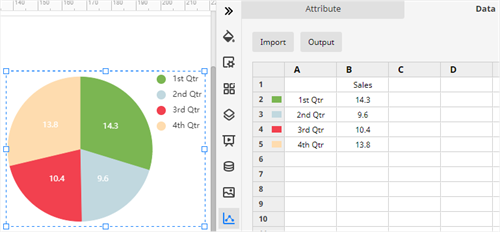
4. Return to Chart (Attribute) pane, and alter chart colors or styles with different editing options. EdrawMax also supports to change chart types and create exploding pie charts.
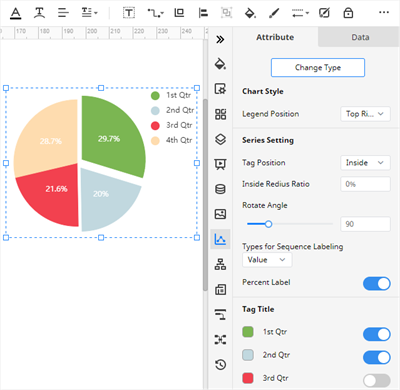
5. If you want to adjust the color or style of other objects or the whole drawing page, you could find the corresponding formatting tools on the horizontal toolbar and the right-side panes.
How to Export an Edraw Chart as a PowerPoint File
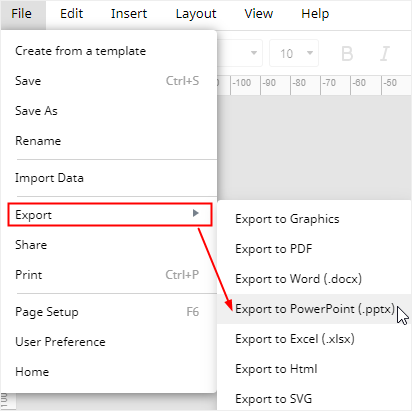
Although EdrawMax is not widely-used like Microsoft PowerPoint in people’s life around the world, you can find it is flexible and adaptable to support users to export any chart and diagram into several common file types that you will use a lot in their work or study.
Go to the File tab, select Export on the drop-down menu and you can choose one of the supported file formats such as Export to PowerPoint (.pptx). In addition, those exported MS Office files from EdrawMax can be viewed, edited and modified on Office programs as usual.