How to Make a Venn Diagram in Google Sheets
Usually, we store and process data in Google Sheets. In addition to being an excellent platform, it also supports to draw. In this post, we talk about how to make and insert a Venn diagram in Google Sheets.
How to Make a Venn Diagram in Google Sheets
Actually, adding circles manually is a basic way to create Venn diagram in Google Sheets, since there aren’t inbuilt Venn templates in this application. Follow these instructions and then we will show you how to easily create a Venn diagram.
Just follow these steps and then we will tell you an easier way of making Venn diagrams.
- Open a new Google spreadsheet.
- Select Insert > Drawing on the ribbon to trigger the Drawing
- Draw circles and add text boxes to complete the Venn diagram.
- Click the Save and Close button if the diagram is done.
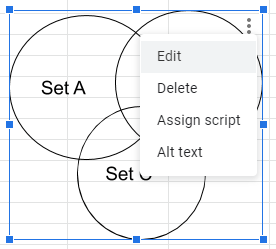
- Click Edit to go back to the Drawing window and make changes in the diagram.
How to Make a Venn Diagram in EdrawMax
However, Google Drawing has some limitations, so you will spend more time in completing and styling a complex Venn diagram. By comparison, you will have a great experience in making Venn diagrams using EdrawMax. With EdrawMax, you can quickly create and customize your Venn diagrams with less hassle.
Step 1: Use an inbuilt Venn Template
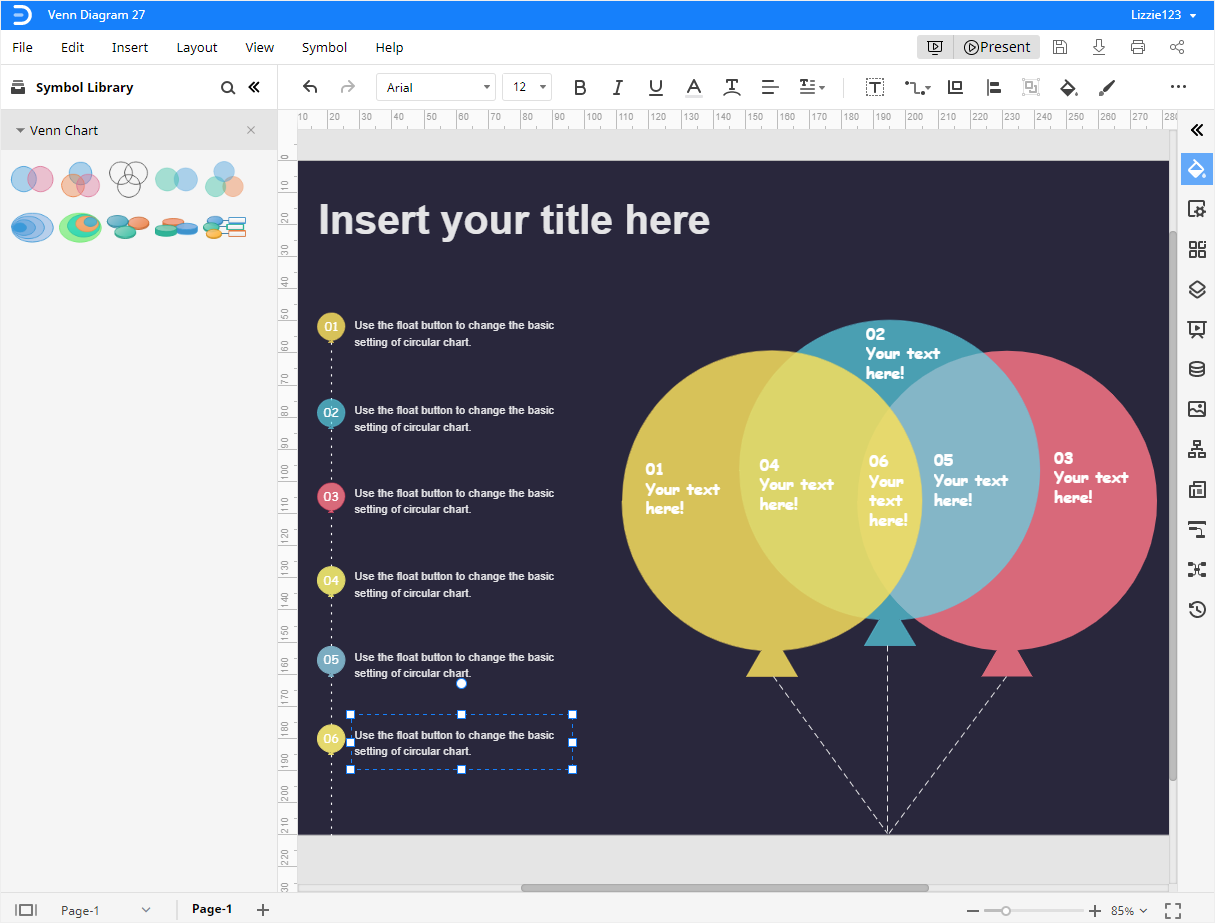
To make a Venn diagram from a template, enter (EdrawMax Online), navigate to Basic Diagram > Venn Diagram, and you’ll find various types of Venn templates shown in the template gallery.
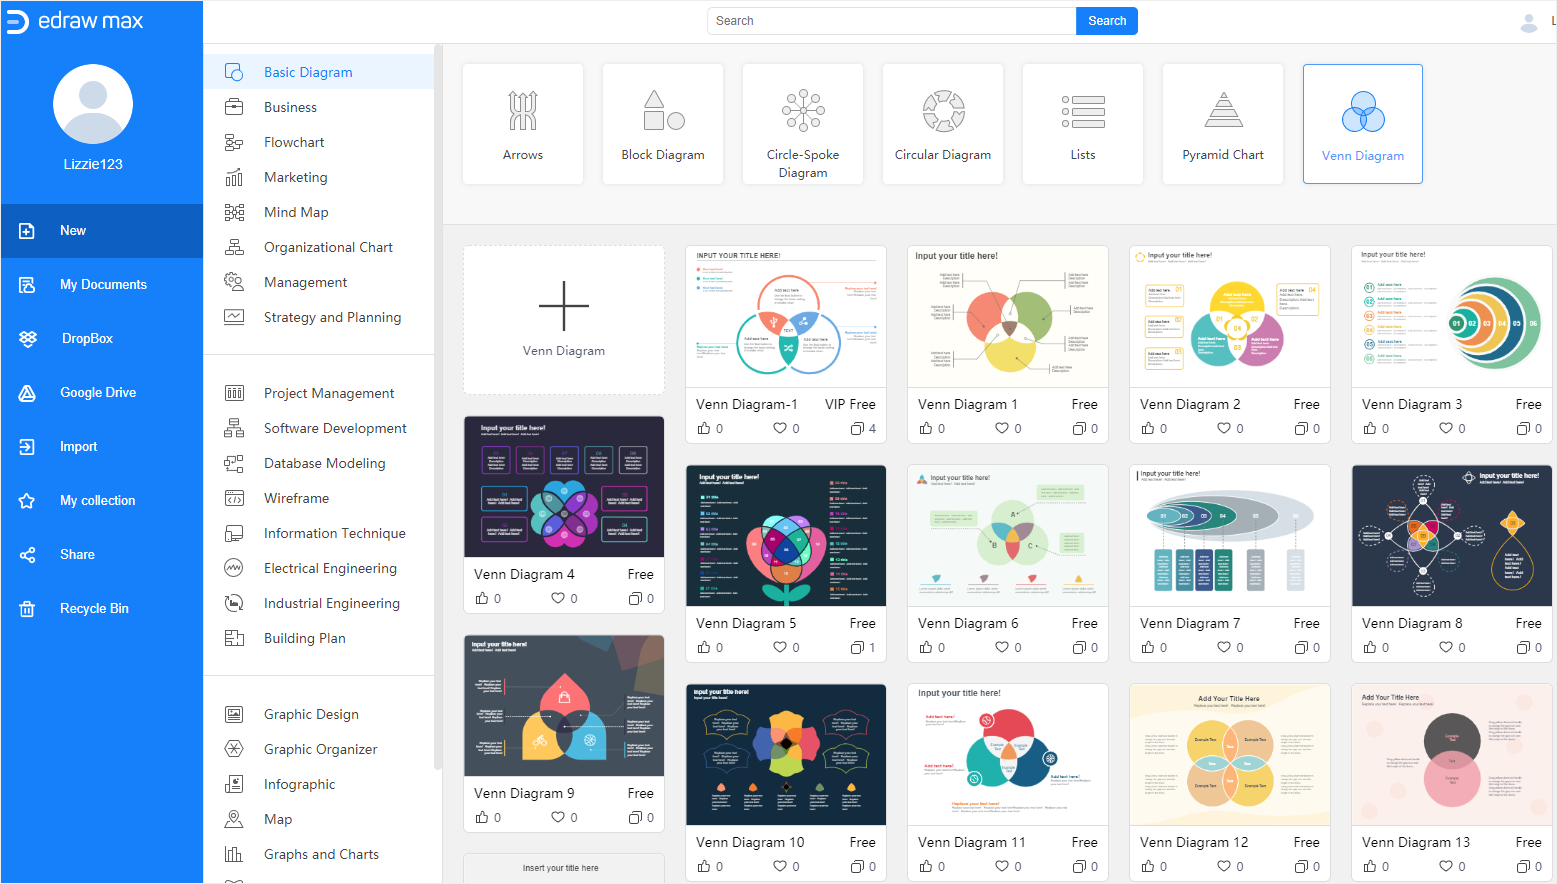
Scroll the page, select a template that you want to use and click on its icon. Then you can edit text or replace Venn shapes on the template.
Step 2: Add Inbuilt Venn Shapes
Similarly, EdrawMax supports users to add Venn shapes manually from the symbol library. These Venn shapes in EdrawMax are also designed specifically for making Venn diagrams.
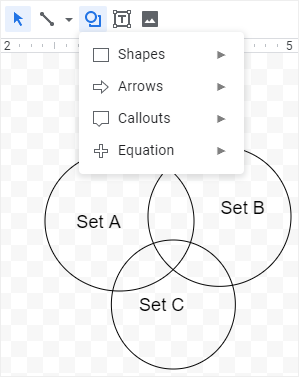
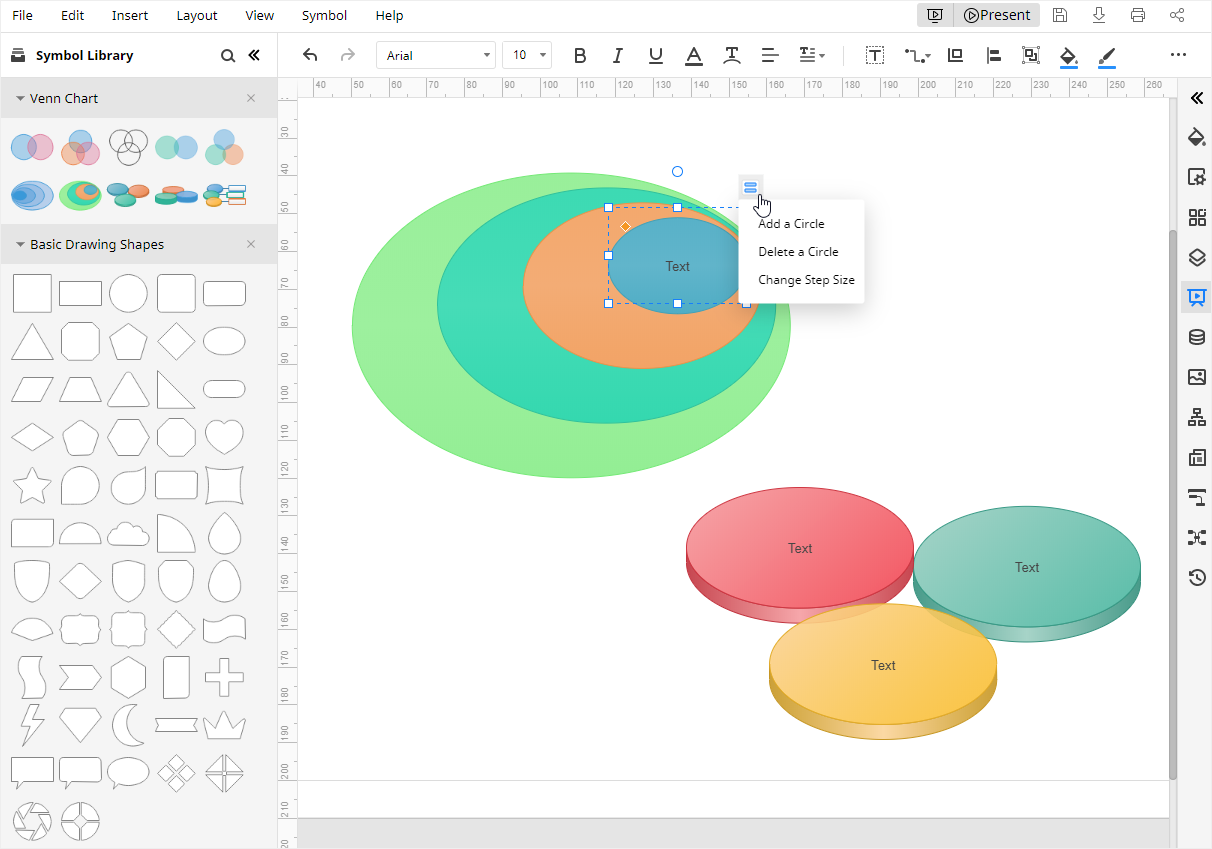
Click on the Symbol Library icon ![]() to open Library dialog box, then tick Venn Chart under the Diagram category and click OK. Simply drag and drop Venn shapes onto the drawing page, click on the floating button in the shape center, you can select to add or delete circles.
to open Library dialog box, then tick Venn Chart under the Diagram category and click OK. Simply drag and drop Venn shapes onto the drawing page, click on the floating button in the shape center, you can select to add or delete circles.
Besides, you can add Basic Drawing Shapes to the Library pane, and drag some basic circles onto the drawing page.
Please note that when you add basic circles on the drawing page, you should select the circles, choose Solid Fill on the Fill/Line/Shadow pane and increase the value of transparency, so you can see the overlapping sections clearly
Step 3: Customize Your Venn Diagram
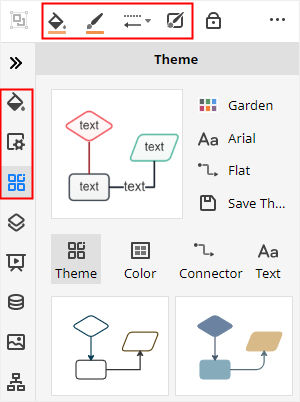
To customize your Venn diagrams, you can use these powerful and smart formatting tools and buttons, which are distributed on the Fill/Line/Shadow pane, Page Setup pane, Theme pane and the toolbars respectively.
You are able to change fill styles, fill colors, line styles, line colors, background colors, diagram themes and apply quick styles to the whole diagram.
Step 4: Present Your Venn Diagram
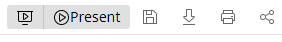
If you want to display your Venn diagram as like making a presentation, you can click the Play button on the upper right corner, and EdrawMax will play the current page in the full-screen mode.
How to Export an Edraw Diagram in Common Formats
When you finish creating your Venn diagram in EdrawMax, you can save and export your Venn diagrams easily.
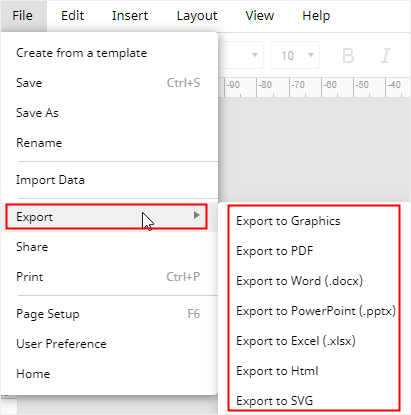
Go to the File tab, click Save As, select to save diagrams in Edraw personal cloud, Google Drive or Dropbox. Click on Export, select to export your diagrams in several commonly-used file formats, including JPEG, PNG, PDF, DOCX, PPTX and XLSX.
Besides, all the MS Office files exported from EdrawMax are editable in those programs. Therefore, you can share your diagrams and charts with your friends, team members or students, even though they haven’t used EdrawMax.
Sign up for EdrawMax and give it a try!