What is The Influence Diagram
Create a Influence Diagram Online Free Free Download Free Download Free Download Free Download1. What is The Influence Diagram?
An influence diagram is a compact illustration of a decision condition in both visual and mathematical terms. Influence diagrams are a visualization method to chart the relationship between the main elements of a decision-setting.
A decision is an attribute that you (or your organization) have the authority to alter as the decision-maker explicitly. When people make decisions, substantial things should be considered in doing business, such as how to invest a new project, how much to spend and sell, where to place a website, or what budget to devote to marketing.
As a project or system gets more complicated, the multiple inter-relationships on a single diagram will become even more challenging to display. One strategy is to limit the influence diagram to one particular aspect of the work, like project relationships, outcomes and benefits, relationships between outputs and risk events, or relationships between projects and stakeholders.
1.1 The Usage of Influence Diagram
- Create a collective awareness of "how things work";
- Facilitate cooperation between technical professionals, decision-makers, and key stakeholders;
- Incorporate information from different backgrounds into decision making;
- Encourage rational learning about the connections between cause and effect;
- Defining standards for assessment;
- Determining simulation and knowledge uses that are specifically relevant to evaluation requirements;
- The corresponding quantitative modeling is standardized;
- Documenting the rationale for expert judgments and strengthening their accountability.
When a decision tree is very abstract and hard to explain certain thing, an influence diagram is more useful as it would provide a higher-level description of what was found using the decision tree.
- Empathy mapping;
- Experience mapping;
- Customer journey mapping;
- Service design (blueprint) mapping.
An experience map draws on a standard, high-level interpretation of human actions to accomplish a clear objective.
1.2 The Elements in Influence Diagram
In influence diagrams, the semantics are of two kinds - Arrows and Nodes.
- Arrow
An arrow will denote an influence. An arrow from A to B implies that understanding A will directly affect our assumption or opinion for B. An effect communicates the pertinence information, which may mean a causal interaction, or a flow of data, information, or money, but need not.
- Node
A node is a predecessor at the beginning of an arc; a node at the end is a successor.
(1) The decision node is shown as a rectangle;
(2) Uncertainty node is drawn as an oval (corresponding to the ambiguity to be based on);
(3) The deterministic node is drawn as a double oval (corresponding to a special kind of uncertainty where the end decision is already known).
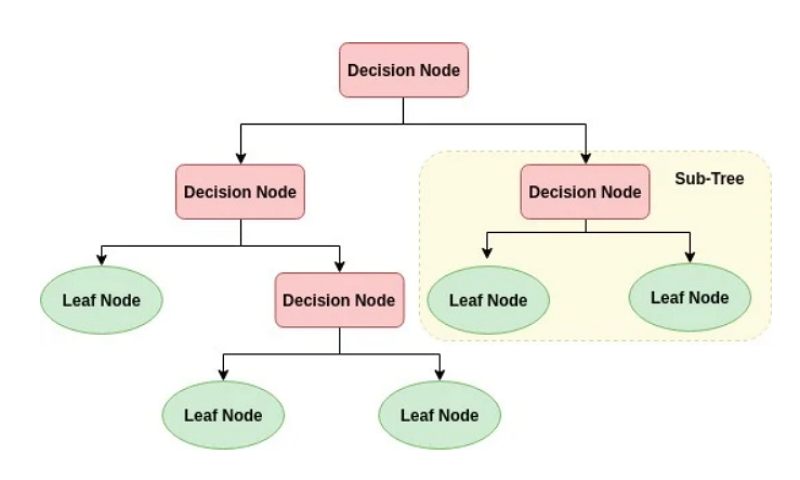
1.3 Influence Diagram vs. Decision Tree
The influence diagram displays system dependency. There is an essential contrast between the influence diagrams and the decision trees. Decision trees provide much more information on a potential decision.
Influence diagrams are directly connected to and mostly used in combination with decision trees. An influence diagram provides a summary of the knowledge in a decision tree.
A decision tree is a diagram of a set of connected choices with different outcomes. It allows a person or organization, based on their costs, probabilities, and benefits, to evaluate available options against each other.
Decision trees can become immensely complicated. A more compact influence diagram may be a suitable substitute in these situations. Influence diagrams simplify the emphasis on essential choices, inputs, and goals.
A decision tree can be used to develop automatic predictive models with machine learning, data mining, and analytics applications.
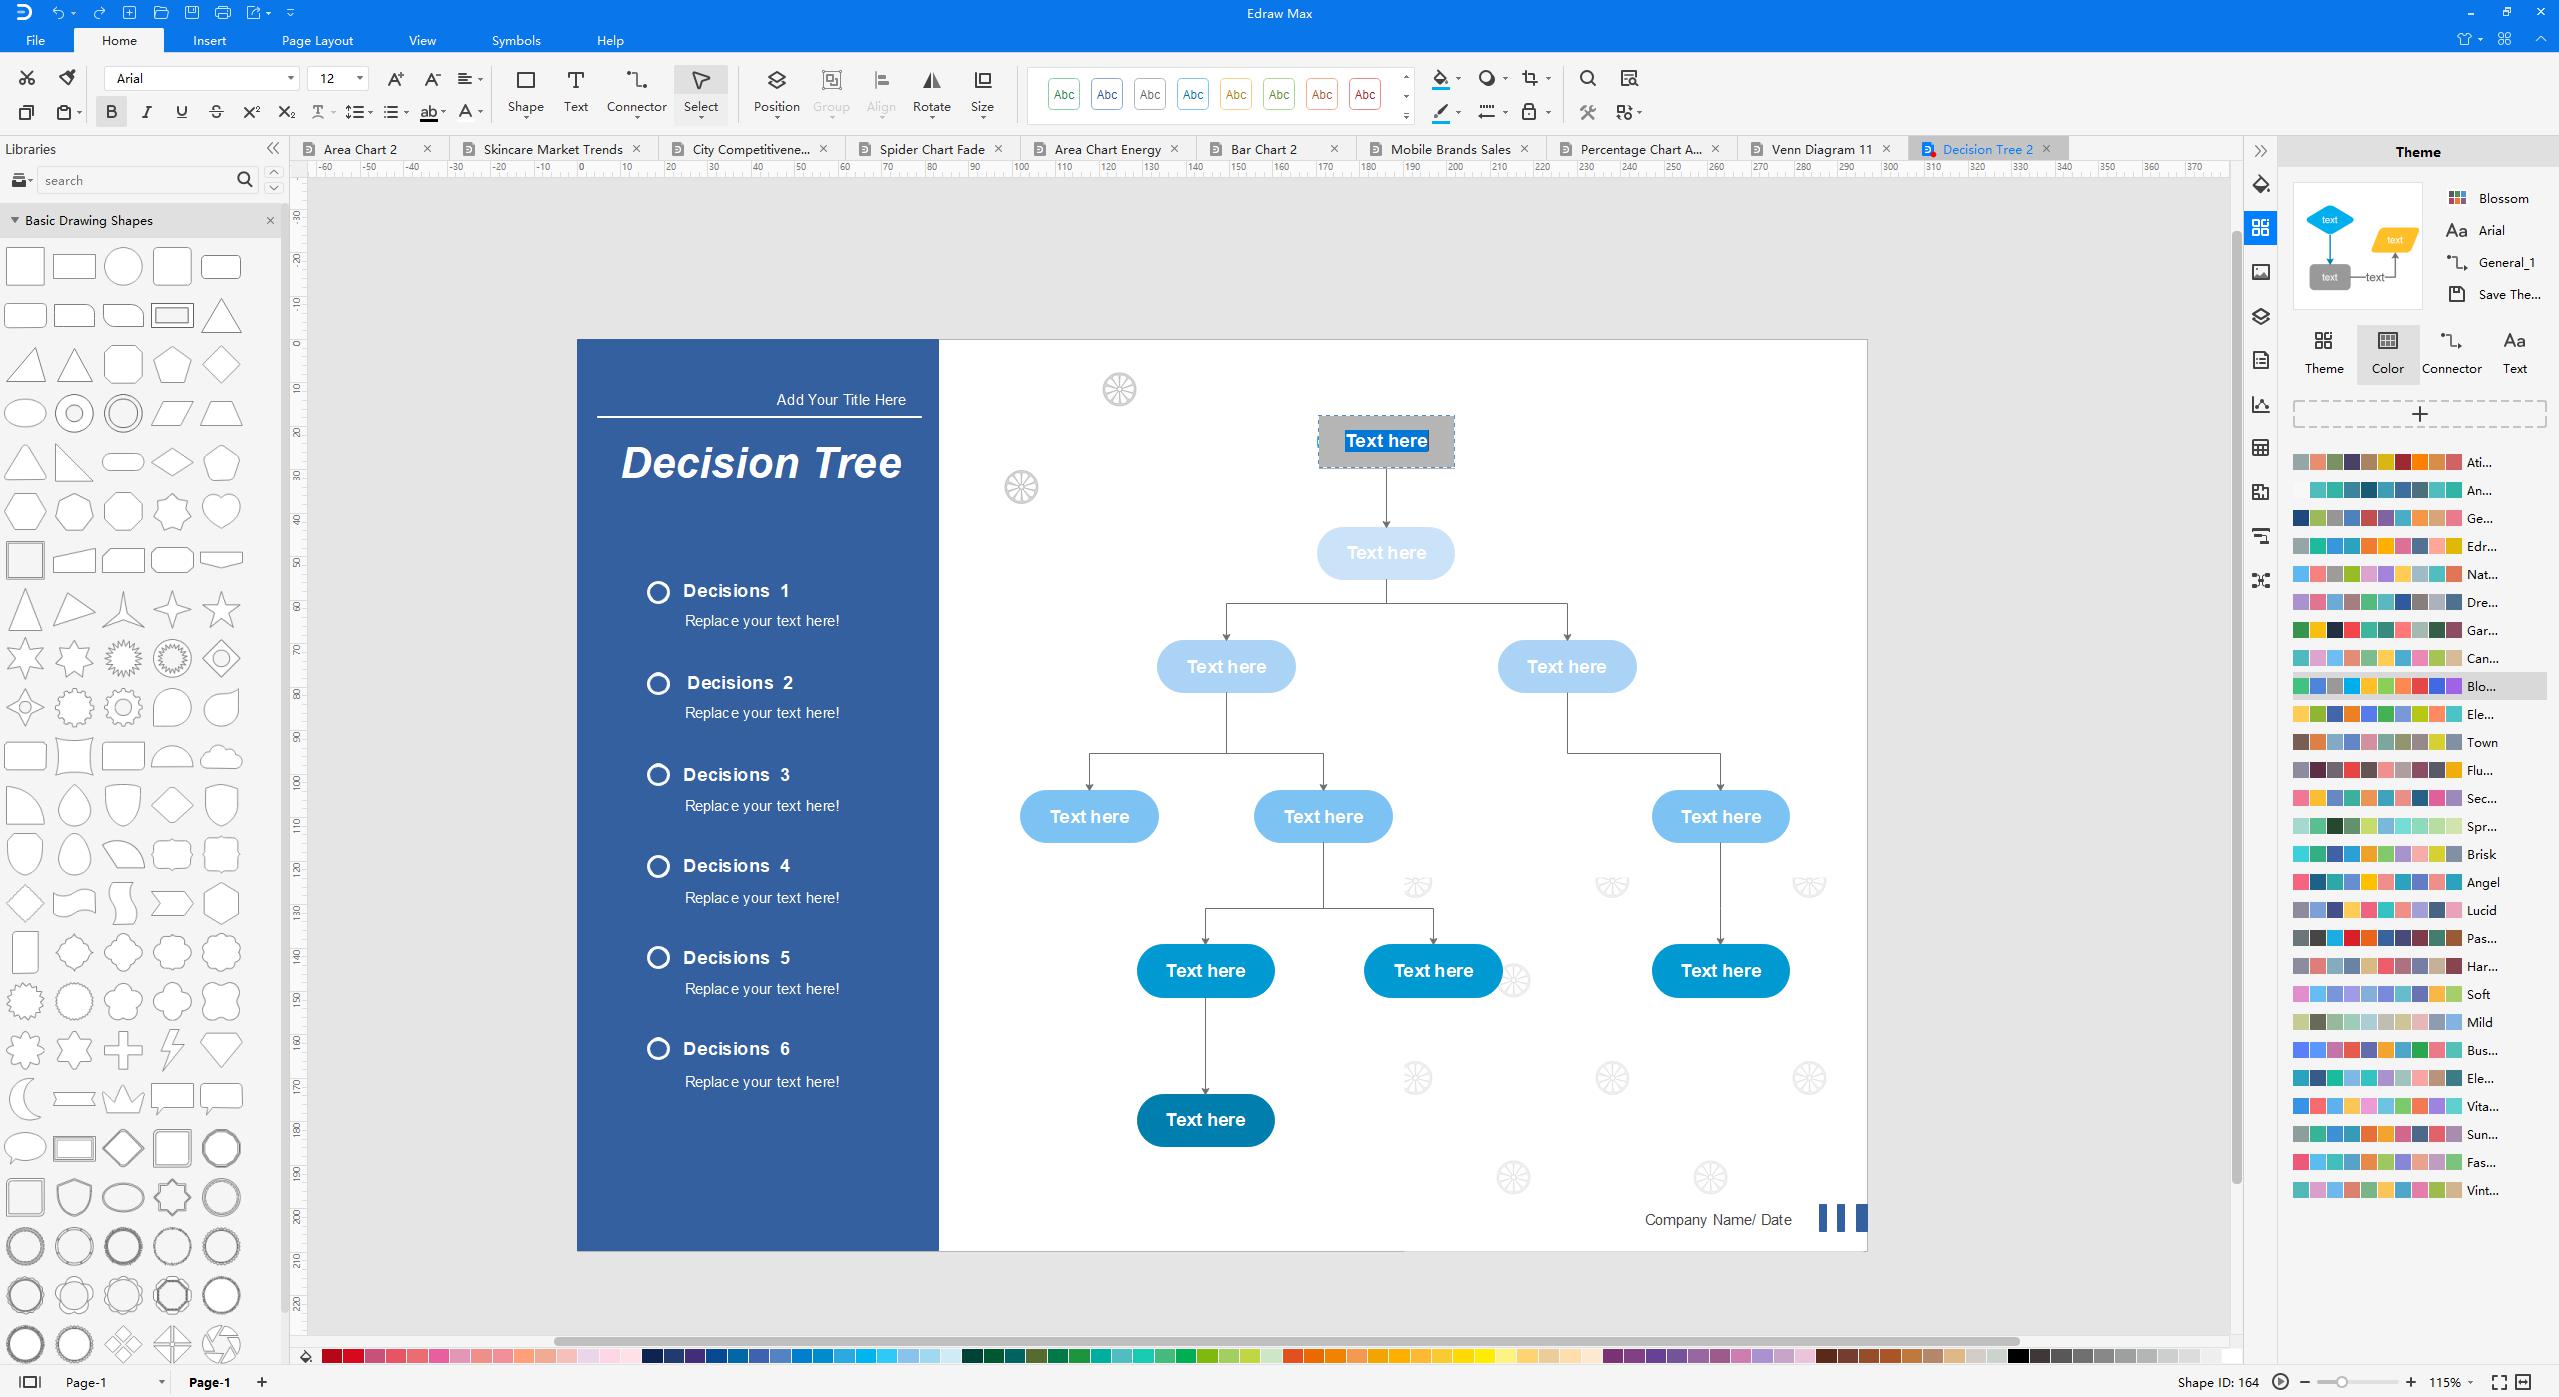
2. How to Create The Influence Diagram in EdrawMax
Step 1: Open EdrawMax and click flowchart to select a proper template.
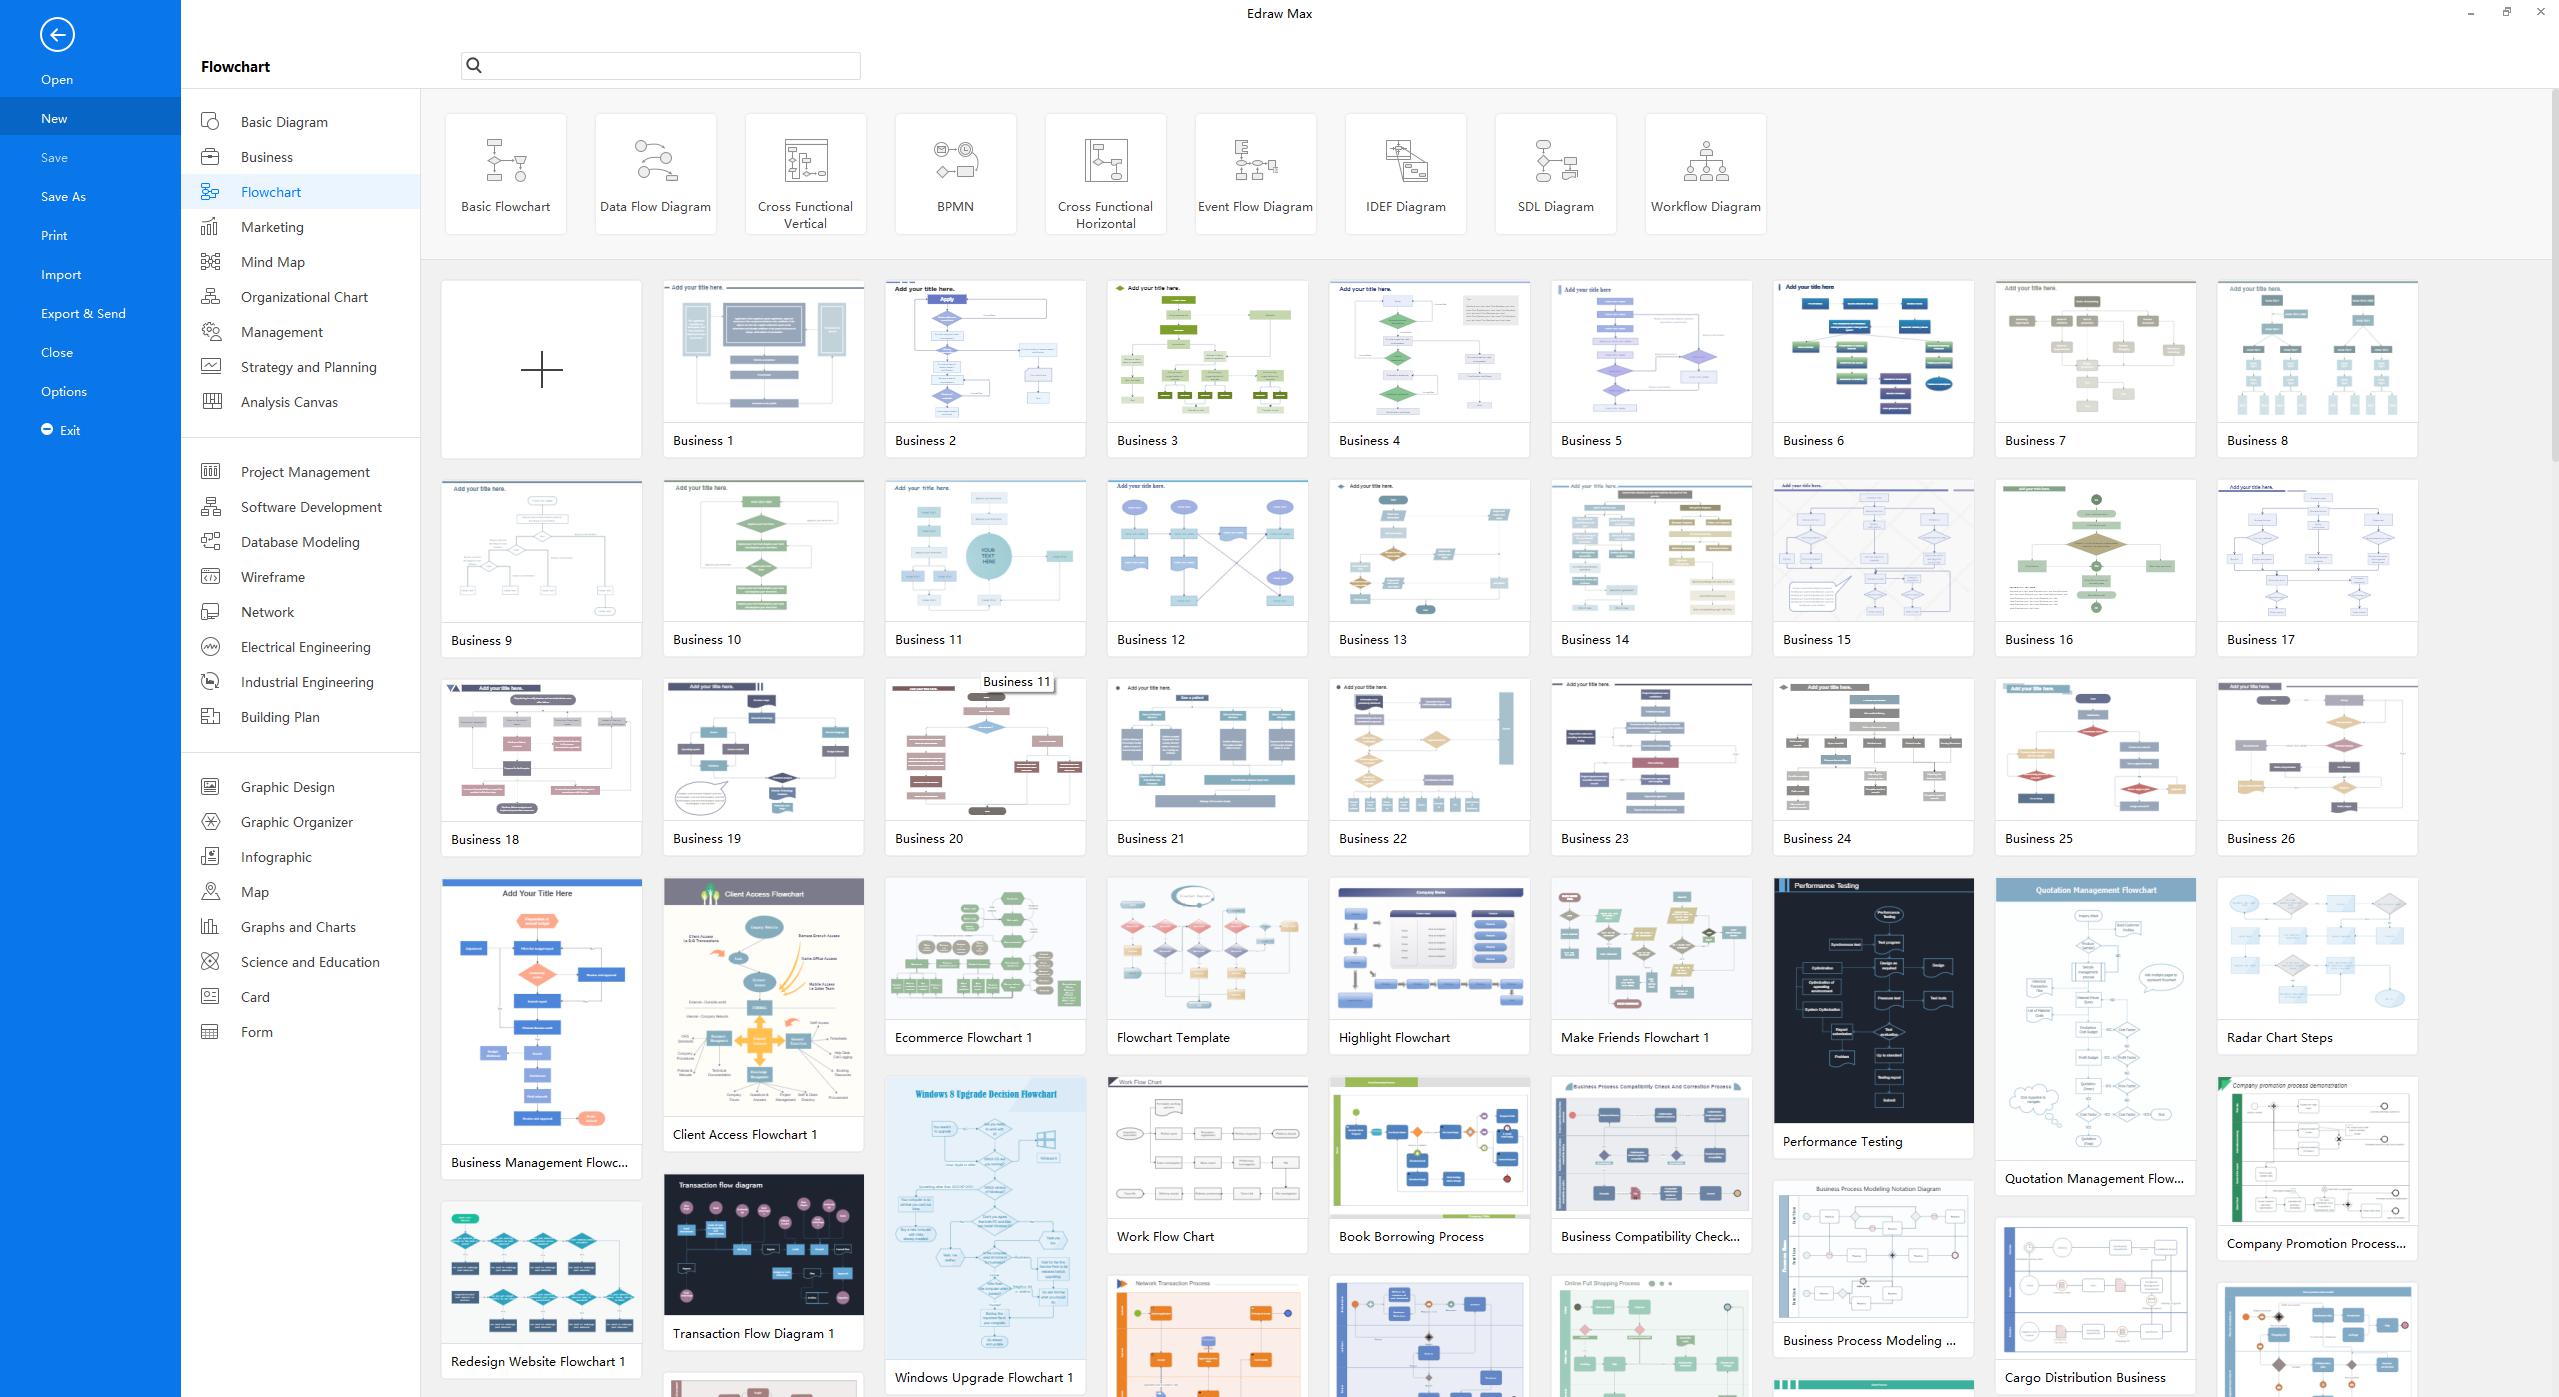
Step 2: According to your needs, to customize anything you like, from text to the shapes.
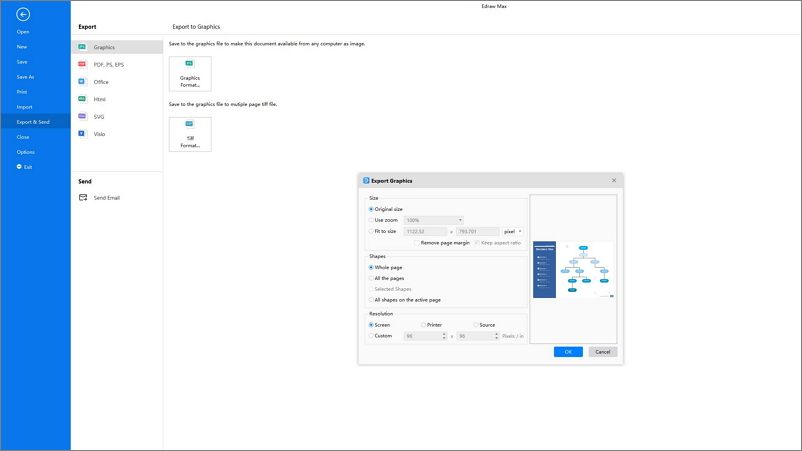
Step 3: Once you are satisfied, just export your influence diagram in various formats, like Microsoft Office, Graphs, PDF, PS, Visio and more.
3. Examples of The Influence Diagram
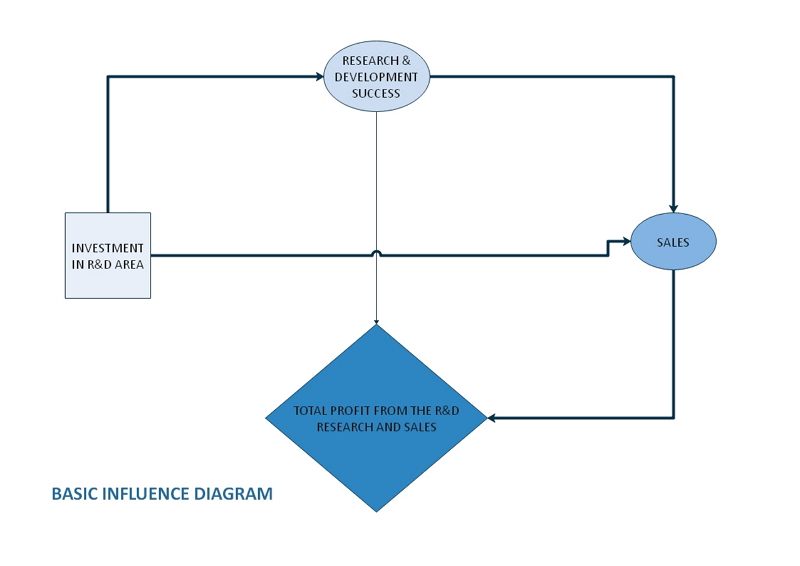
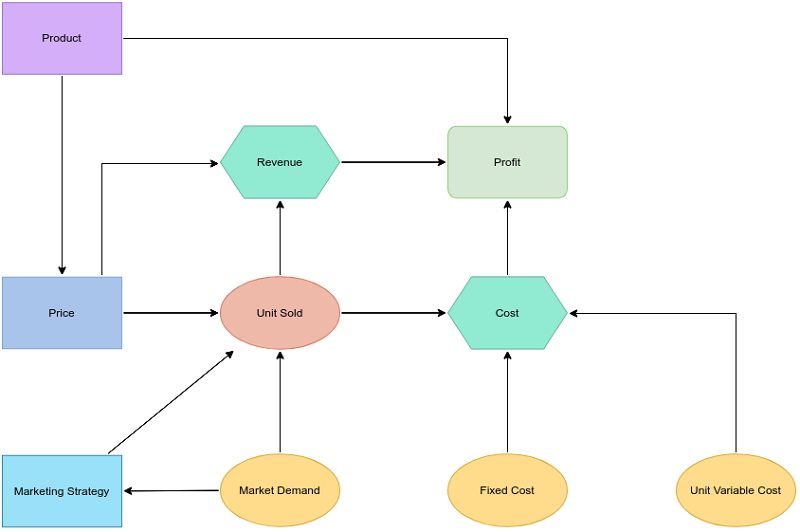
The first example is a basic influence diagram, which illustrates how the business operates from investment to the final making profits. Since it is the simple influence diagram, the information has been visualized and easy to understand.
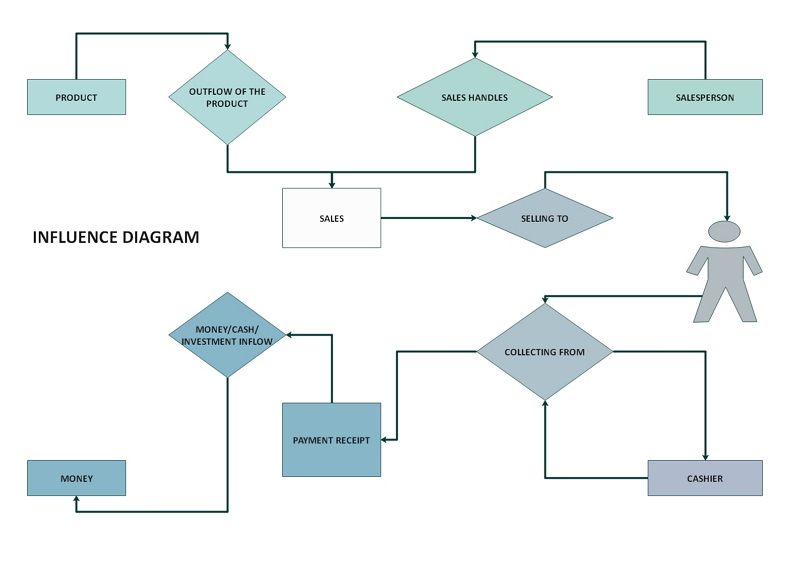
The above example denotes the influence diagram of a store including aspects like salesperson, cashier, product, money, etc. This diagram represents the key areas of decision and uncertainty and is connected with arrows.
4. Conclusion
The Influence diagrams are a primary method to help you learn of the relations between goals, solutions, and outcomes. They will offer a conventional interpretation of "how things work" and how various variables influence us. The influence diagram provides a high-level conceptual view on which you can create a detailed, quantitative model.EdrawMax influence diagram creator is a advanced full-featured application with powerful features. It is extremely user friendly and offers 100% data protection when it comes to security.


