Free Editable Flowchart Infographic Examples
1. What Is Flowchart Infographic
A flowchart infographic shows a sequence of involved steps in a process or actions. It uses a combination of layout, images, and text to make the communication of your process, it's working, and its goals clear and effective to all stakeholders. Flowchart infographics help increase engagement and give a very clear idea about the process and its works. The positive side is that it does not delve into technical details, and even the layman can understand the processing.
2. The Flowchart Infographic Examples
An effective infographic has various aspects; for example, you need the right type and amount of information to add, an attractive layout, and relevant graphics. Another important aspect is to decide the file format, resolution, and dimensions of your infographic so that they can be distributed and displayed. So, let us visit some examples to explore all these aspects.
Example 1: Flowchart Infographic
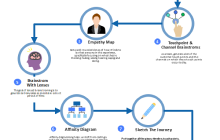
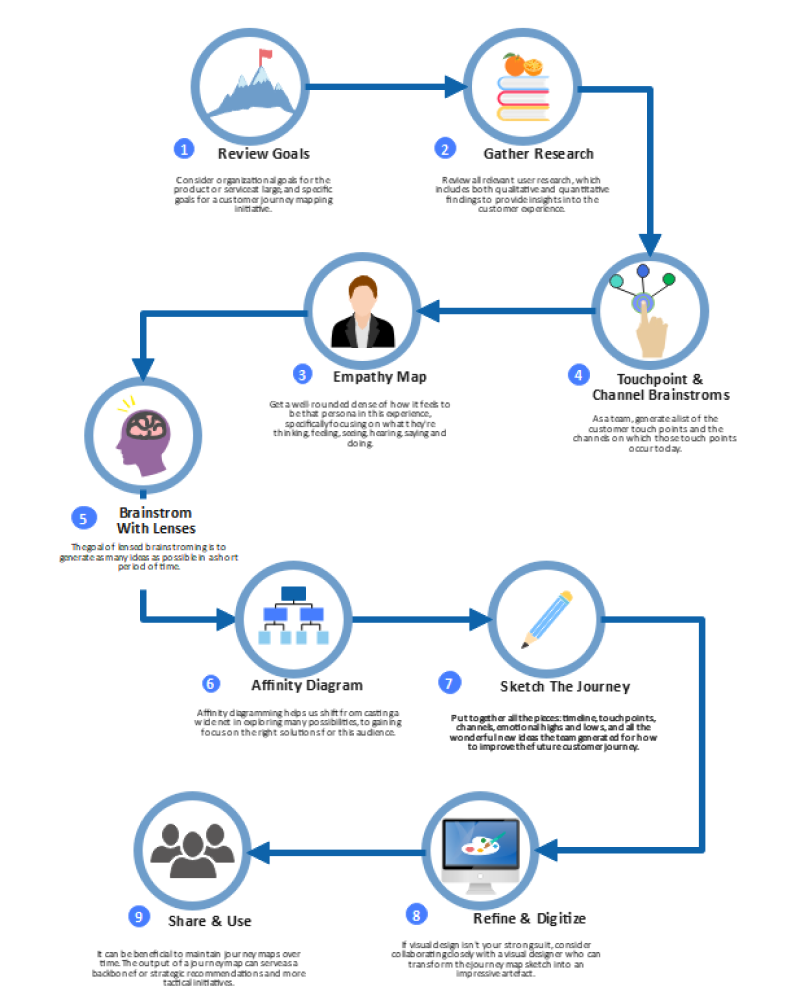
This flowchart infographic example shows a detailed description of a customer journey map. It is an excellent example to understand a customer's mindset and focus on how to capture and improve their experience with your business or website. Any business must understand the impression of your customer and what can be done to improve it is.
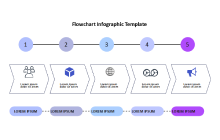
Example 2: Flowchart Infographic Template
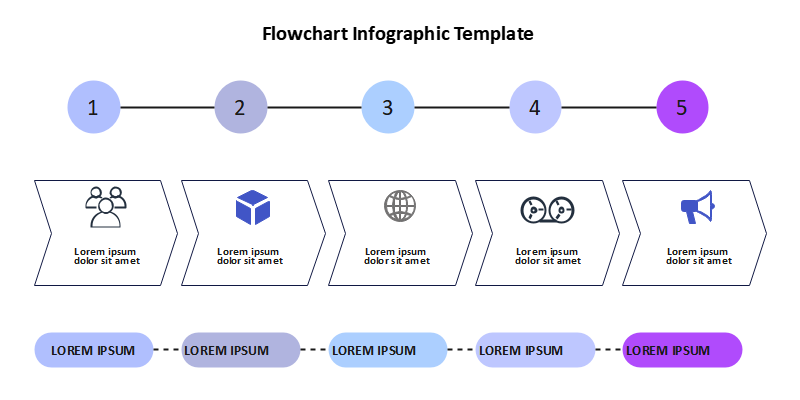
The flowchart infographic in this example shows the progress of a process in a horizontal progress bar. This template is fully customizable, and you can add or delete the steps and add your text to describe your process details. This template gives you a quick start with a simple yet impressive layout, and by just adding your text, you are good to go.
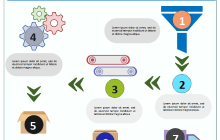
Example 3: The Best Flowchart Infographic
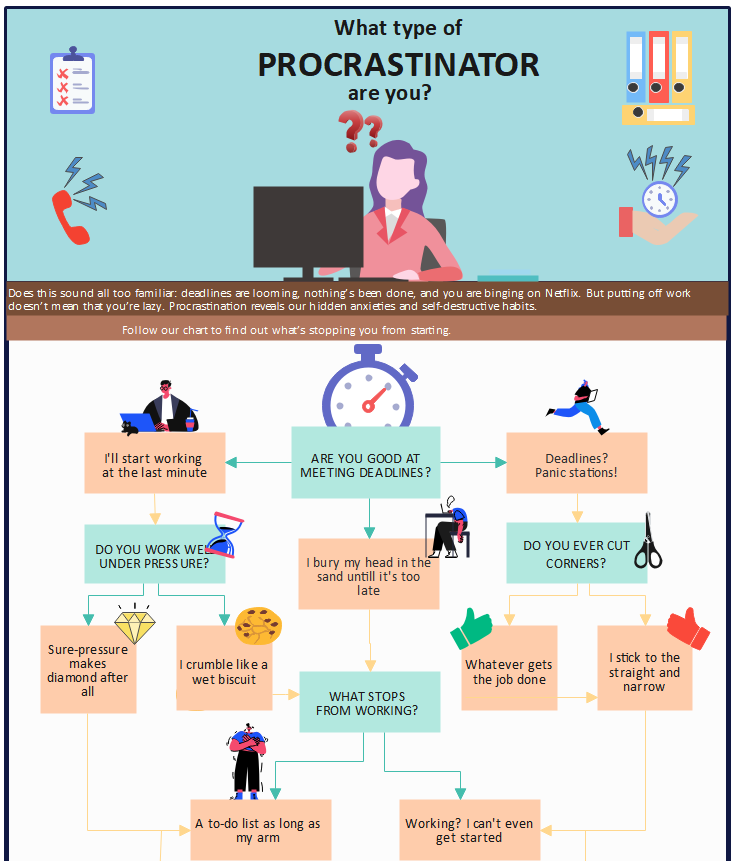
Are you still trying to find the Best Flowchart Infographic? We got the Best Flowchart Infographic for you if that is the case. This type of Flowchart Infographic will help you to recognize deadlines and goals. It will keep you alert during your project. If you ever encounter an issue, you can easily find the issue with these Flowchart infographics. Its highly engaging visual representation is more valuable than you think. A proper Flowchart Infographic can give a complete breakdown of any workflow process.
Example 4: Manufacturing Flow Chart Infographic
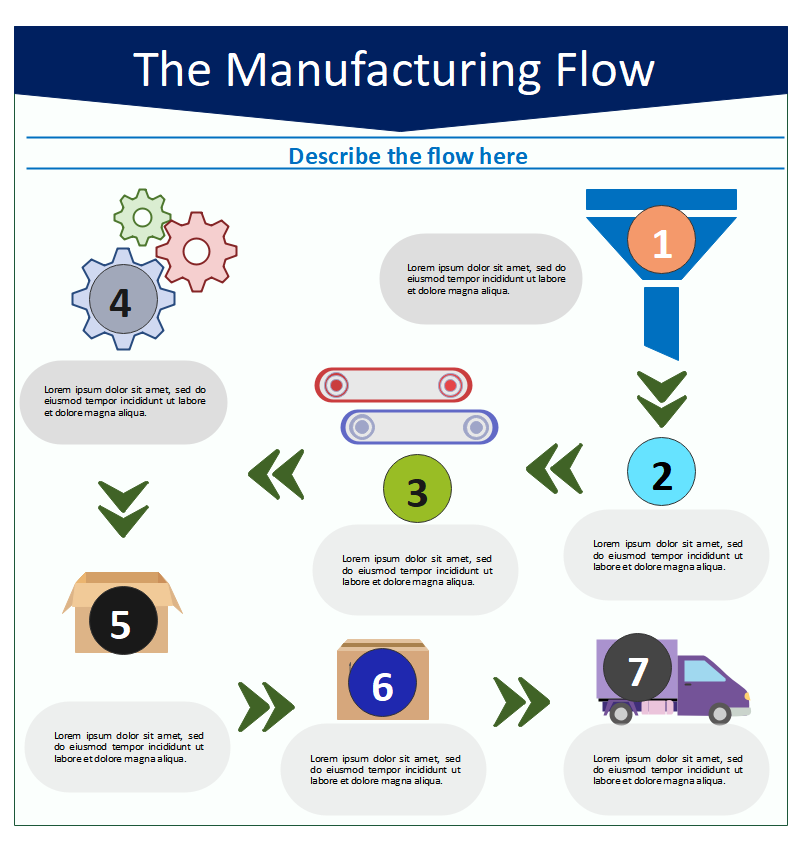
Manufacturing and production are lengthy and sensitive processes; therefore, clear understanding from all stakeholders is critical. Therefore a manufacturing flowchart infographic is an important tool in such processes, and it is used in company literature manuals and displayed on the worksite. Use the customizable template to create your manufacturing flowchart infographic in a standardized format.
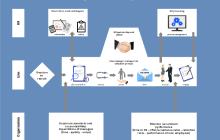
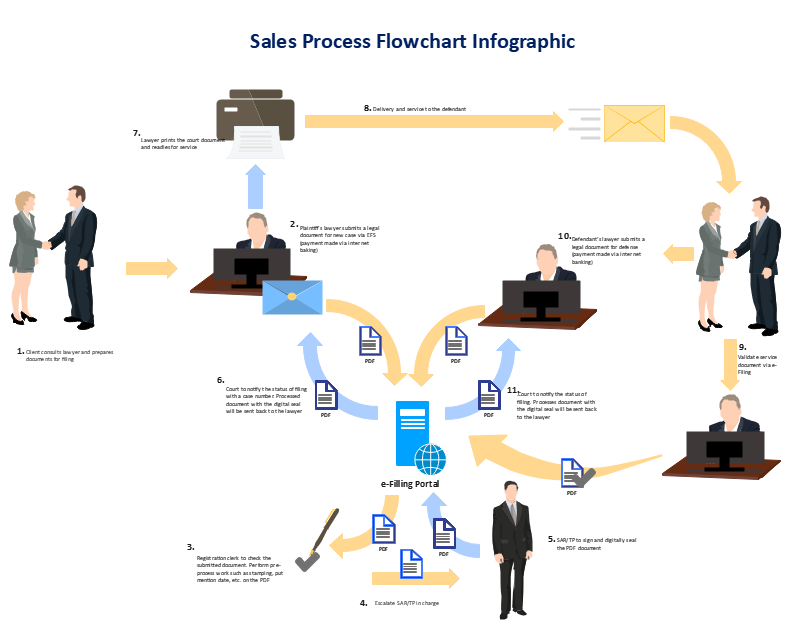
Example 5: Sales Process Flowchart Infographic
Sales process flowchart infographic helps your audience understand the different dynamics of the process and the involved dependencies over other tasks and people. This example also shows the flow of documents that can be more specific with proper labeling according to your environment.
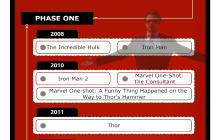
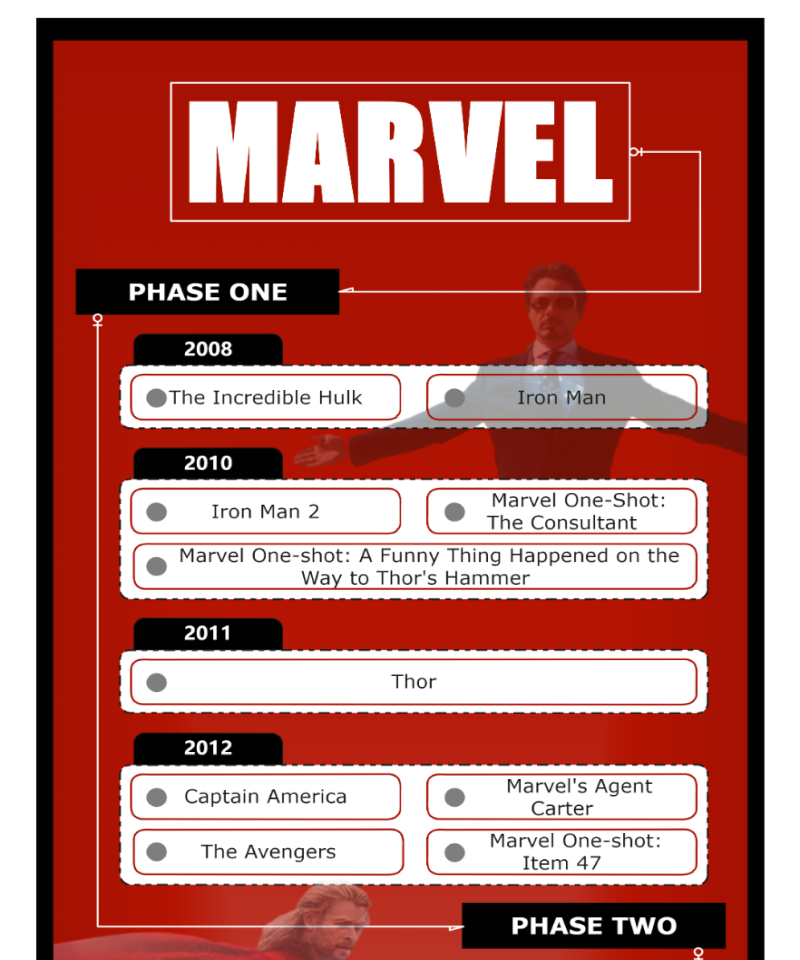
Example 6: Marvel Movie Flowchart Infographic
If you are a marvel movie fan, you are in luck today. This marvel movie flowchart infographic can see the complete overview of these movies and seasons. It is a text-based infographic that classifies the data into different categories based on years. You can also use this template for data that needs clear classification and categorization.
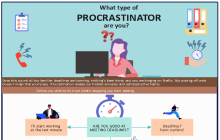
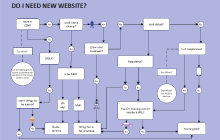
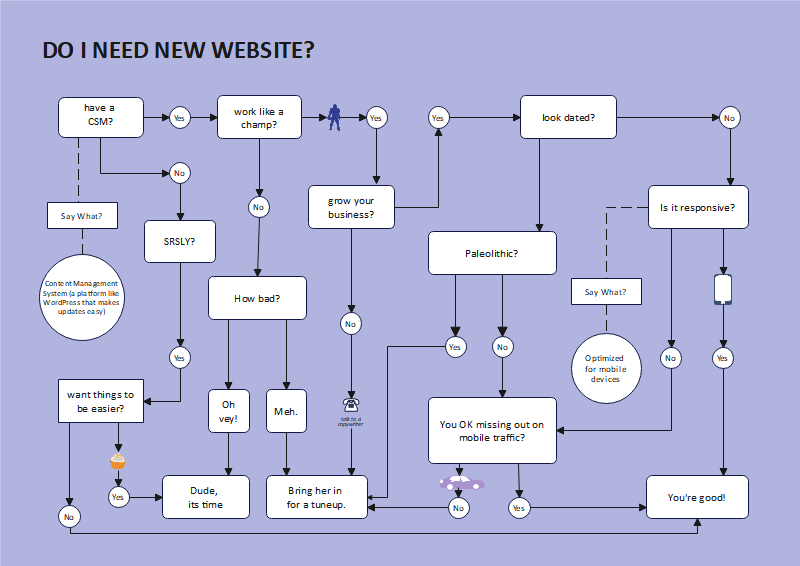
Example 7: Yes No Flowchart Infographic
Yes, no flowchart infographic is an excellent tool in brainstorming and idea generation sessions. You ask some questions with yes and no answers. Based on these answers, the flow of the process or idea moves forward. It is also used in problem-solving processes to determine where the main culprit is.
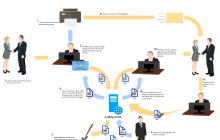
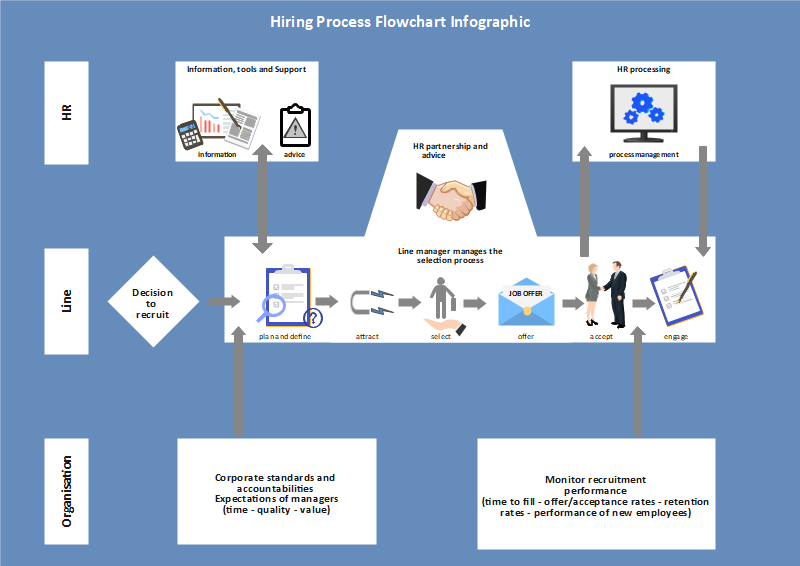
Example 8: Hiring Process Flowchart Infographic
The hiring process flowchart infographic shows the complete process of hiring that is spanned over many departments. It is critical to communicate the process details and deliverables with various departments involved to keep the information integrated and widely understood.
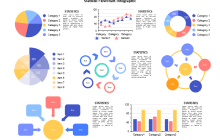
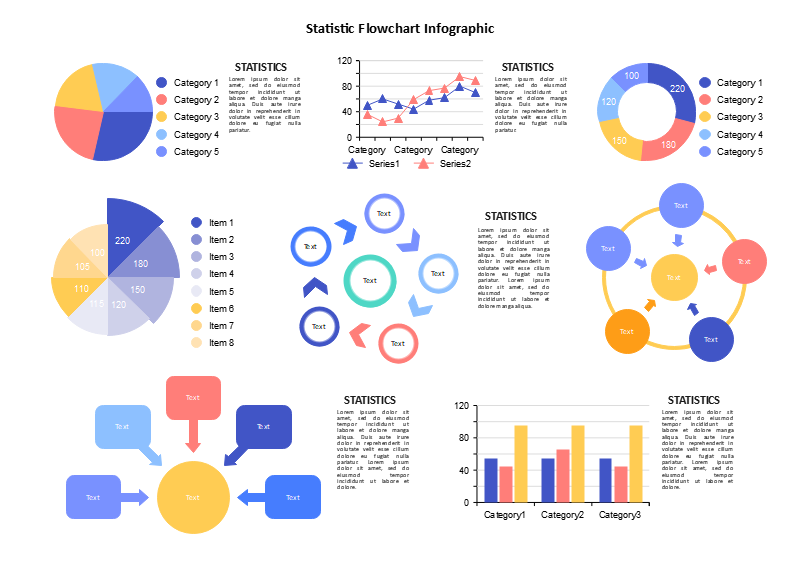
Example 9: Statistic Flowchart Infographic
Data is a critical element in many fields, especially marketing, business analysis, ROI calculation, prediction, etc. However, the heaps of numbers in spreadsheets are difficult to comprehend, and adding visual representations makes data communication easier and widely acceptable. You can use bar charts, waffle charts, graphs, and other data visualization forms in a statistic flowchart infographic.
3. How to Design a Flowchart Infographic
EdrawMax allows you to design a flowchart infographic within minutes with an easy-to-use layout and a wide variety of templates. However, you must perform the pre-designing steps very accurately e,g, the analysis and collection of data. Let us quickly go through the step-wise process.
Step 1-Set your infographic's goal and audience: Like any other task, you have to build your work with detailed analysis and insight. While analyzing your flowchart infographic, you need to focus on two questions. Number one, who is the audience and what is the medium of communication, and number two, what is the goal of your infographics.
Step 2 - Contents of your infographic: Now, it is time to decide what information and data you will include in your infographic. You will decide the images, the text, the data, and the amount of data you will include. So, if you need a bar chart, what are the dimensions for it; you need a graph, what numbers you will represent, and so on.
Step 3 - Plan the infographic details: Now, go into the physical aspects of your flowchart infographic, e.g., the aspect ratio, the dimensions, file type, and the distribution method, to optimize your work accordingly. Also, you can create a wireframe to decide the placement of different elements and the layout. Also, the color theme and graphical elements are important here.
Step 4 - Get inspired: EdrawMax infographic maker has a wide templates library covering many diagrams, including flowchart infographics. These templates are professionally made, and you will notice that the best industry practices are followed in aesthetics, content, and presentation. You can pick any template from the library to download and customize to optimize it for your use.
Step 5 - Customize: Flowchart infographic templates give a quick start and a strong foundation. Most of the work is already done, so you need to make a few tweaks and push in your data. Use the text formats, font colors, sizes, images, clipart, and symbols to make it suitable for your needs.
Step 6 - Download, export, share or embed your infographic: Download your completed flowchart infographic, or you can export your work in multiple formats, e.g., pdf, ppt, jpeg, gif, doc, etc., for platform-independent access and distribution. We also recommend exploring the social media sharing and printing options.
Watch this video to learn more. If the video doesn't play, please visit it at YouTube.
4. Online Infographic Maker
An online infographic maker supports you throughout the journey of designing infographics. EdrawMax is a comprehensive yet affordable infographic maker with a wide variety of symbol libraries, clipart, and an option to import your brand assets to add your company's identity to your work. The text and font customization tool kits allow you to beautify and customize your text to make it prominent and affect the audience. We are sure you can quickly create an excellent flowchart infographic within minutes using the templates and easy-to-use layout from EdrawMax.
5. Key Takeaways
Flowchart infographics are very interesting yet tricky documents to create. It combines images, layout, and text to communicate the steps of a process to help everyone understand the work independent of technical expertise. An online infographic maker EdrawMax allows you to create infographics very easily, and it gives you a quick start with downloadable and completely customizable templates. EdrawMax Templates Community. is a great place to visit to get inspiration from samples designed by the industry's best professionals and to use their experience in your work. Find more infographic templates.